20 Covariance Structure: Final Model
20.1 Final Model
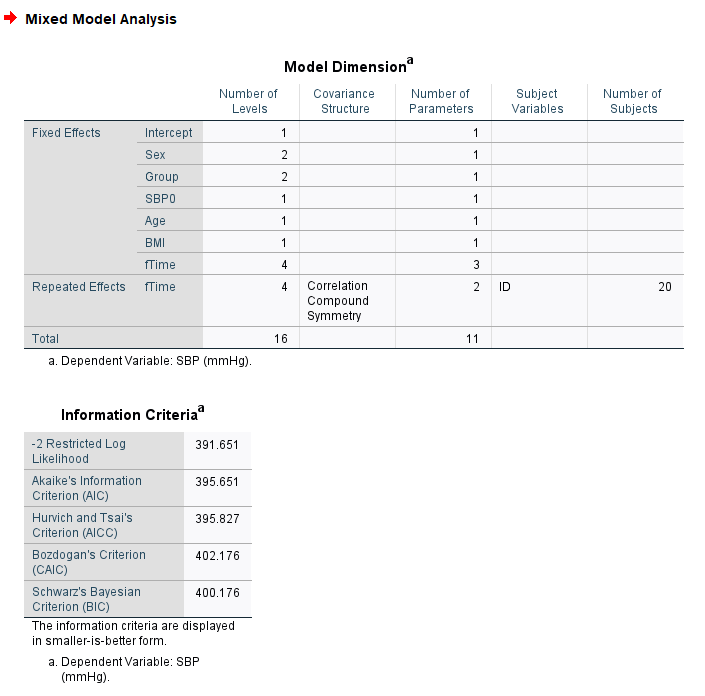
Comparing the performance metrics using AIC and BIC, we conclude that compound symmetry (CSR) structure of the covariance shows the smallest BIC value and smaller AIC value. The model fit also does not show any convergence issues. Hence, the compound symmetry covariance structure for the R-side describes the data better than other covariance types investigated here.
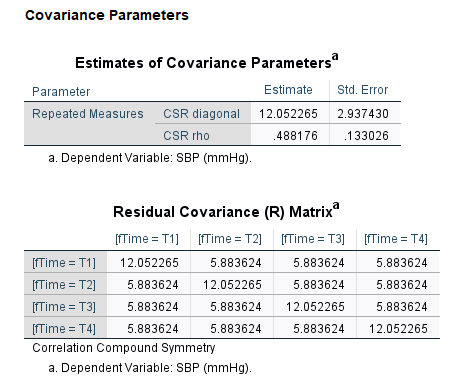
Hence, we fit the final model using the CSR covariance structure. Note this is equivalent to fitting the model with patient as a random intercept. We fit the final model using REML as estimation method.
20.2 SPSS: Script
MIXED SBP BY Sex Group fTime WITH SBP0 Age BMI
  /CRITERIA=DFMETHOD(SATTERTHWAITE) CIN(95) MXITER(100) MXSTEP(10) SCORING(1)
    SINGULAR(0.000000000001) HCONVERGE(0, ABSOLUTE)
    LCONVERGE(0, ABSOLUTE) PCONVERGE(0.000001, ABSOLUTE)
  /FIXED=Sex Group SBP0 Age BMI fTime | SSTYPE(3)
  /METHOD=ML
  /PRINT=G  R SOLUTION
  /REPEATED=fTime | SUBJECT(ID) COVTYPE(CSR)
20.3 Final Model: Summary
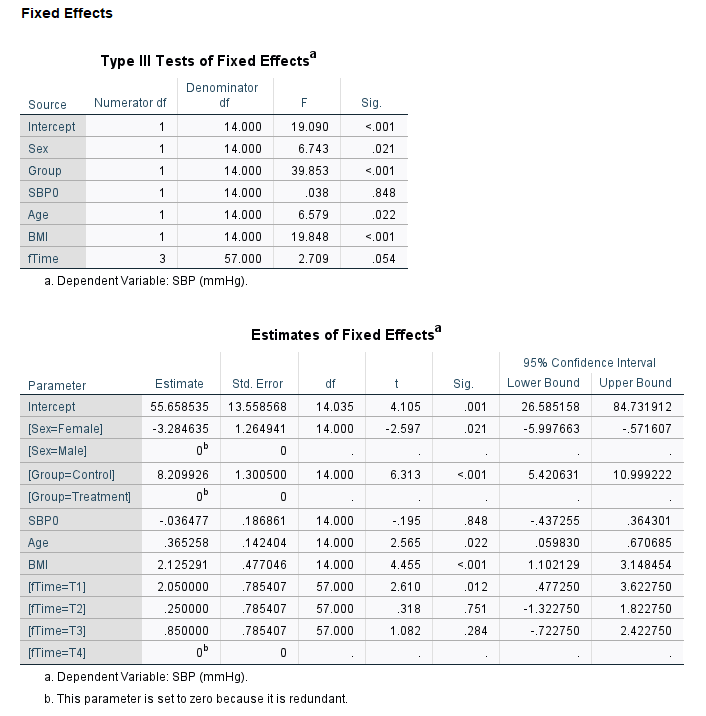
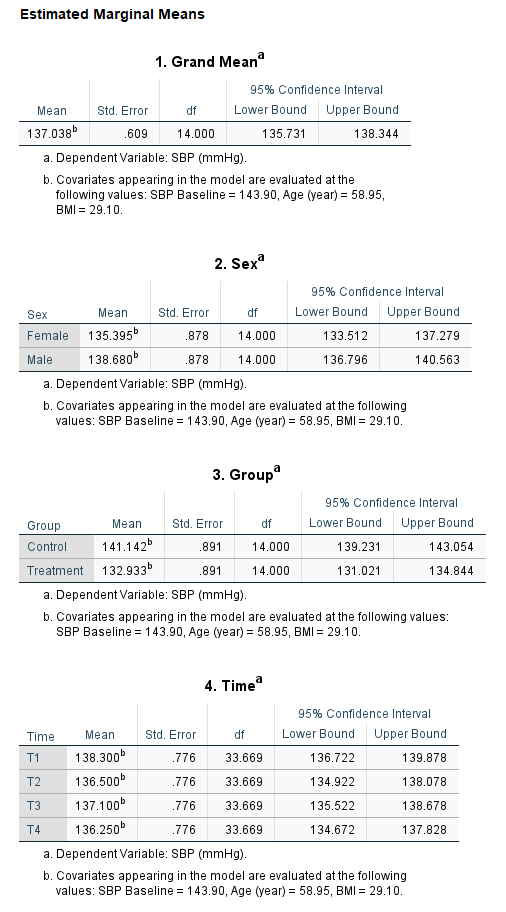
The summary of the outputs from the final model is presented here.
20.4 Model diagnostics
We can create several plots to check the model assumptions.
Conditional raw residuals
Conditional Studentised residuals
Influence diagnostics
20.5 Interpretation of results
We investigated several covariance structure for the model. We can conduct LRT or compare AIC values to identify the ideal covariance structure that fits the data.
Presented here the final model with compound symmetry covariance structure. Explore all model outcomes and identify the covariance structure that is suitable for the data.