| Function | Explanation |
|---|---|
traceback() |
prints out the function call stack after an error occurs; does nothing if there is no error |
debug() |
flags a function for debug mode which allows to step through execution of a function one line at a time |
undebug() |
to take off the debug mode flags from a function |
debugonce() |
flags a function for debug mode only once; the function does not need undebug after it runs once. |
browser() |
suspends the execution of a function wherever it is called and puts the function in debug mode |
trace() |
allows you to insert debugging code into a function a specific places |
recover() |
allows to modify the error behavior so that you can browse the function call stack |
27 R Debugging: General
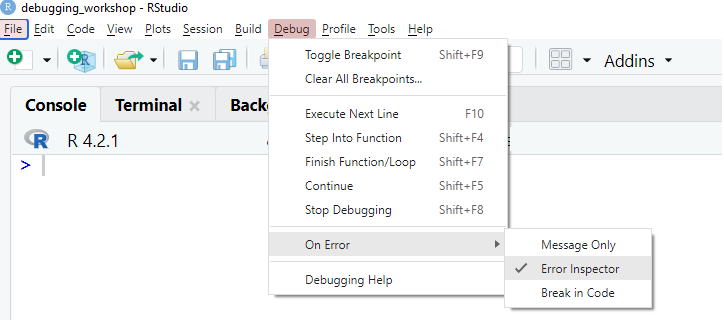
27.1  Debugging tool
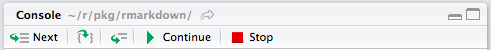
In the Debug mode of browser window, you can move around the function:
Type
nto execute the next line of code (RStudio: PressEnterorF10or the relevant debug toolbar icon)Type
sto step into the current function call (RStudio: PressShift+F4or the relevant debug toolbar icon)Type
fto finish remaining of the current function or loop (RStudio: PressShift+F7or the relevant debug toolbar icon)Type
cto continue the execution until the next breakpoint is encountered (RStudio: PressShift+F5or the relevant debug toolbar icon)Type
Qto stop and exit the debug mode (RStudio: PressShift+F8or the relevant debug toolbar icon)If you have a variable names as
n,s,f,c,Q, then useprint(variable_name)You can also use other standard R commands to explore the objects in the function environment.
27.2 RStudio Environment