Section 39 ANOVA with Blocking: Estimated Effects
39.1 Estimates: Effects
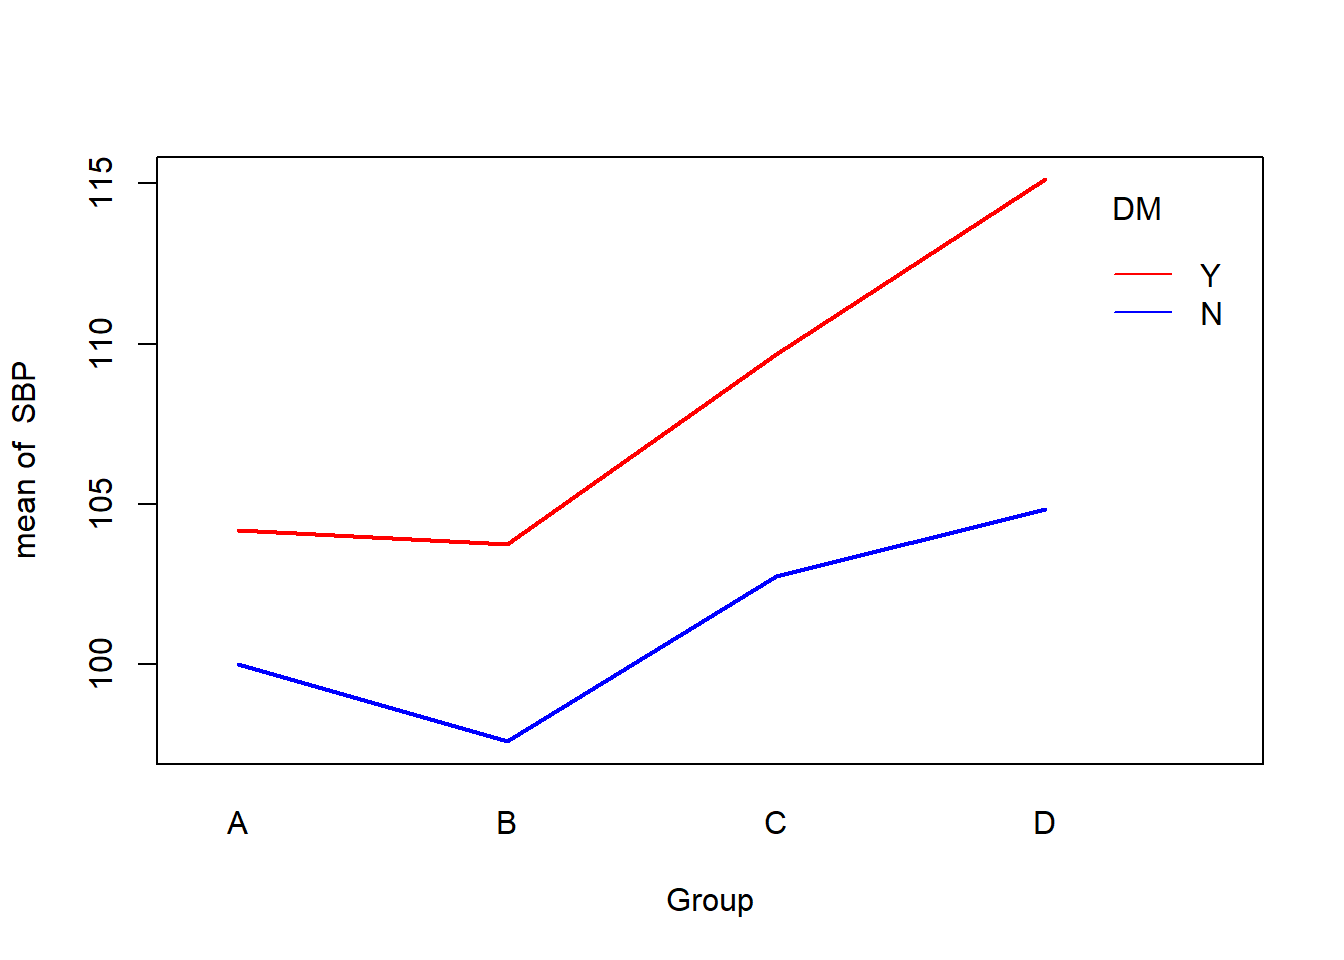
fm←lm(SBP∼Centre+Group+DM+Group:DM, data=BP)
summary(fm)
| Estimate | Std. Error | t value | Pr(>|t|) | |
|---|---|---|---|---|
| (Intercept) | 99.905 | 0.9808 | 101.8621 | 0.0000 |
| CentreH2 | -0.375 | 0.8953 | -0.4188 | 0.6758 |
| CentreH3 | 0.225 | 0.8953 | 0.2513 | 0.8019 |
| CentreH4 | 0.125 | 0.8953 | 0.1396 | 0.8891 |
| CentreH5 | 0.500 | 0.8953 | 0.5585 | 0.5772 |
| GroupB | -2.400 | 1.1325 | -2.1192 | 0.0354 |
| GroupC | 2.760 | 1.1325 | 2.4371 | 0.0157 |
| GroupD | 4.840 | 1.1325 | 4.2737 | 0.0000 |
| DMY | 4.200 | 1.1325 | 3.7086 | 0.0003 |
| GroupB:DMY | 1.960 | 1.6016 | 1.2238 | 0.2226 |
| GroupC:DMY | 2.720 | 1.6016 | 1.6983 | 0.0911 |
| GroupD:DMY | 6.080 | 1.6016 | 3.7962 | 0.0002 |