Section 41 ANOVA with Blocking: function aov
The function
aovalso fits an analysis of variance model by a call tolmfor each stratum for a balanced experimental design.If the formula contains an
Errorterm, this is used to specify error strata, and appropriate models are fitted within each error stratum.If you have multiple error terms in the data, then the
aovis the appropriate function to fit anova model.
41.1 Estimates: Effects
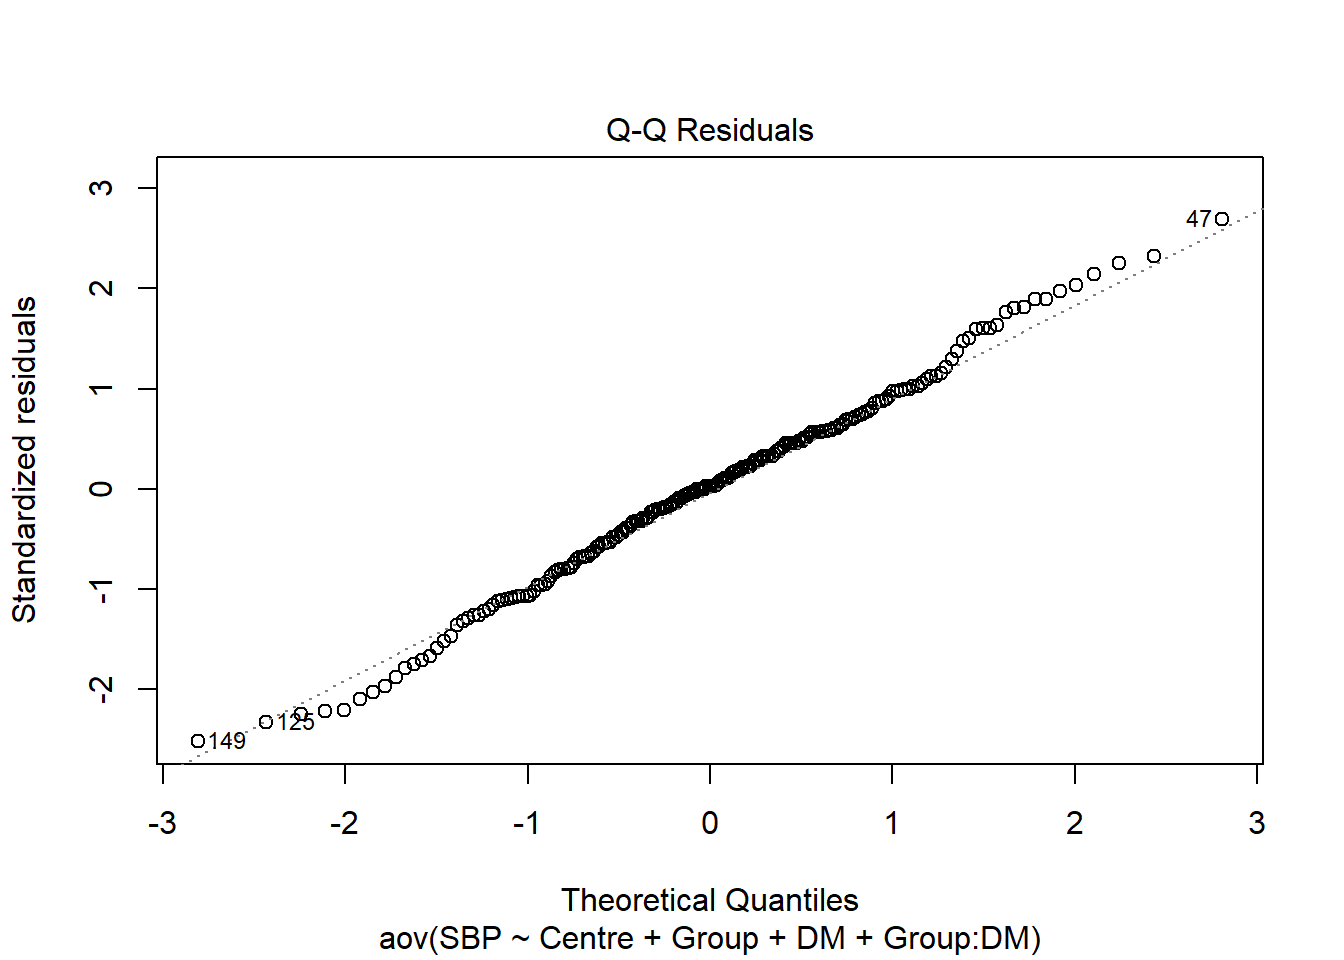
\[ \large fm.aov \leftarrow aov(SBP \sim Centre + Group + DM + Group:DM, \space data=BP) \]
\[ \large aov(fm.aov) \]
\[ \large summary(fm.aov) \]
41.2 Using aov function
# function `aov`
fm.aov <- aov(SBP ~ Centre + Group + DM + Group:DM, data = BP)


# function `aov` with error stratum

# fm1.aov <- aov(SBP ~ Group + DM + Error(Centre), data=BP)


# Analysis of variance
summary(fm.aov)
Df Sum Sq Mean Sq F value Pr(>F)
Centre 4 16.5 4.1 0.257 0.90522
Group 3 2655.1 885.0 55.202 < 2e-16 ***
DM 1 2373.6 2373.6 148.051 < 2e-16 ***
Group:DM 3 240.8 80.3 5.006 0.00231 **
Residuals 188 3014.1 16.0
---
Signif. codes: 0 '***' 0.001 '**' 0.01 '*' 0.05 '.' 0.1 ' ' 1Tables of effects
Centre
Centre
H1 H2 H3 H4 H5
-0.095 -0.470 0.130 0.030 0.405
Group
Group
A B C D
-2.645 -4.065 1.475 5.235
DM
DM
N Y
-3.445 3.445
Group:DM
DM
Group N Y
A 1.345 -1.345
B 0.365 -0.365
C -0.015 0.015
D -1.695 1.695
Standard errors of effects
Centre Group DM Group:DM
0.6331 0.5663 0.4004 0.8008
replic. 40 50 100 25Tables of means
Grand mean
104.745
Centre
Centre
H1 H2 H3 H4 H5
104.65 104.28 104.88 104.78 105.15
Group
Group
A B C D
102.10 100.68 106.22 109.98
DM
DM
N Y
101.30 108.19
Group:DM
DM
Group N Y
A 100.00 104.20
B 97.60 103.76
C 102.76 109.68
D 104.84 115.12
Standard errors for differences of means
Centre Group DM Group:DM
0.8953 0.8008 0.5663 1.1325
replic. 40 50 100 25