Section 11 Confidence Interval: Summary
11.1 Interpretation
In the Frequentist view, if an experiment is repeated 1000 times (drawn 1000 samples) and 95% CI is calculated for each occasion, then the 950 of the calculated 1000 CIs will include the true population mean \(\mu\).
In other words, the probability that an estimated confidence interval includes the true population mean \(\mu\) is 0.95.
One of the common mistakes in interpreting the confidence interval is the following statement: The probability that the true population mean \(\mu\) falls between the lower value and the upper value of a confidence interval is 95%. Remember that \(\mu\) is a constant, not a random variable, and we cannot assign a probability statement on \(\mu\).
11.2 Calculation
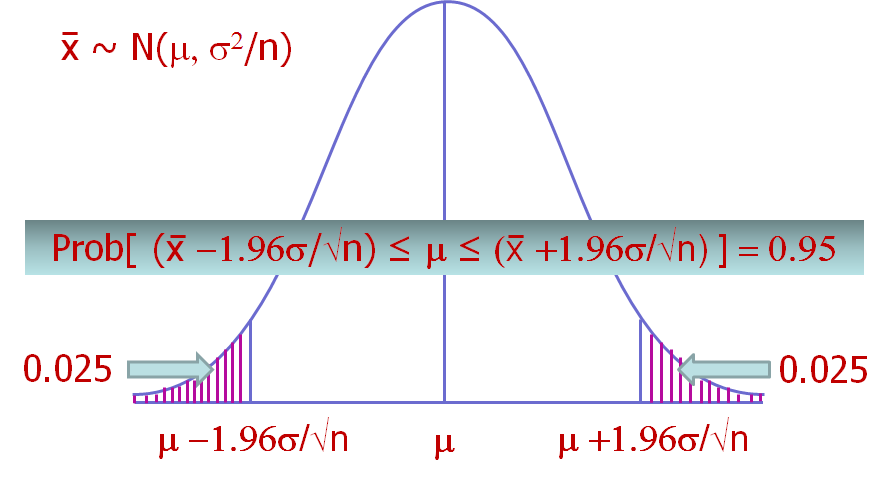
A 95% confidence interval of the mean is given by:
\[ \Huge CI_{0.95}(\bar{x}) = \bar{x} \pm 1.96\frac{\sigma}{\sqrt{n}}\]
In practice, the population standard deviation has to be estimated from the sample and confidence intervals are based on a t-distribution.
Approximate \(100(1-\alpha)%\) confidence intervals for the mean can be calculated as:
\[ \Huge CI_{100(1-\alpha)}(\bar{x}) = \bar{x} \pm t_{\alpha/2, df}\frac{s}{\sqrt{n}}\]
For example, approximate 95% confidence intervals for the mean can be calculated as: \[ \Huge CI_{0.95}(\bar{x}) = \bar{x} \pm t_{0.025, df}\frac{s}{\sqrt{n}}\]
Statistical packages give exact confidence intervals based on the appropriate t-distribution.