24 Python: Matplotlib
-
Matplotlibis a comprehensive library for creating -
The package is integrated with other third party packages
24.1 Matplotlib: Overview
Matplotlibis a comprehensive library for creating static, animated, and interactive visualizations in PythonMatplotlibcan create high-quality plots and interactive figuresMany components of
Matplotlibare similar to Rbaseplot, although implementation is differentIt is integrated with
pandasand many third party packagesSee the previous chapter for
pandasimplementation ofMatplotlibHere we present a typical implementation of
MatplotlibSee Matplotlib tutorials for a comprehensive usage of the package
The link for quick tips and tricks of
MatplotliboptionsInstall
MatplotlibfromPyPIrepository:pip install matplotlib
24.2 A Typical Implementation of Matplotlib
24.2.1 Load Libraries & Read Data 
Import matplotlib
import matplotlib.pyplot as plt
Import other libraries
import pandas as pd
import numpy as np
Set the working directory to the data folder
Read the iris dataset as a Python object DF
DF = pd.read_csv('iris.csv')
24.2.2 Implementation
# A figure with a single axes
fig, ax = plt.subplots()

# Create scatter plot
colors = {'setosa': 'red', 'versicolor': 'blue', 'virginica': 'green'}
Species = DF.Species.unique()
ax.scatter(x = DF.SepalLength, y = DF.PetalLength, marker = 'o', c = DF.Species.map(colors), alpha = 0.5)

# Axes labels
ax.set_xlabel('Sepal Length (cm)')
ax.set_ylabel('Petal Length (cm)');

# Legends
# ax.legend()

# Show plot
plt.show()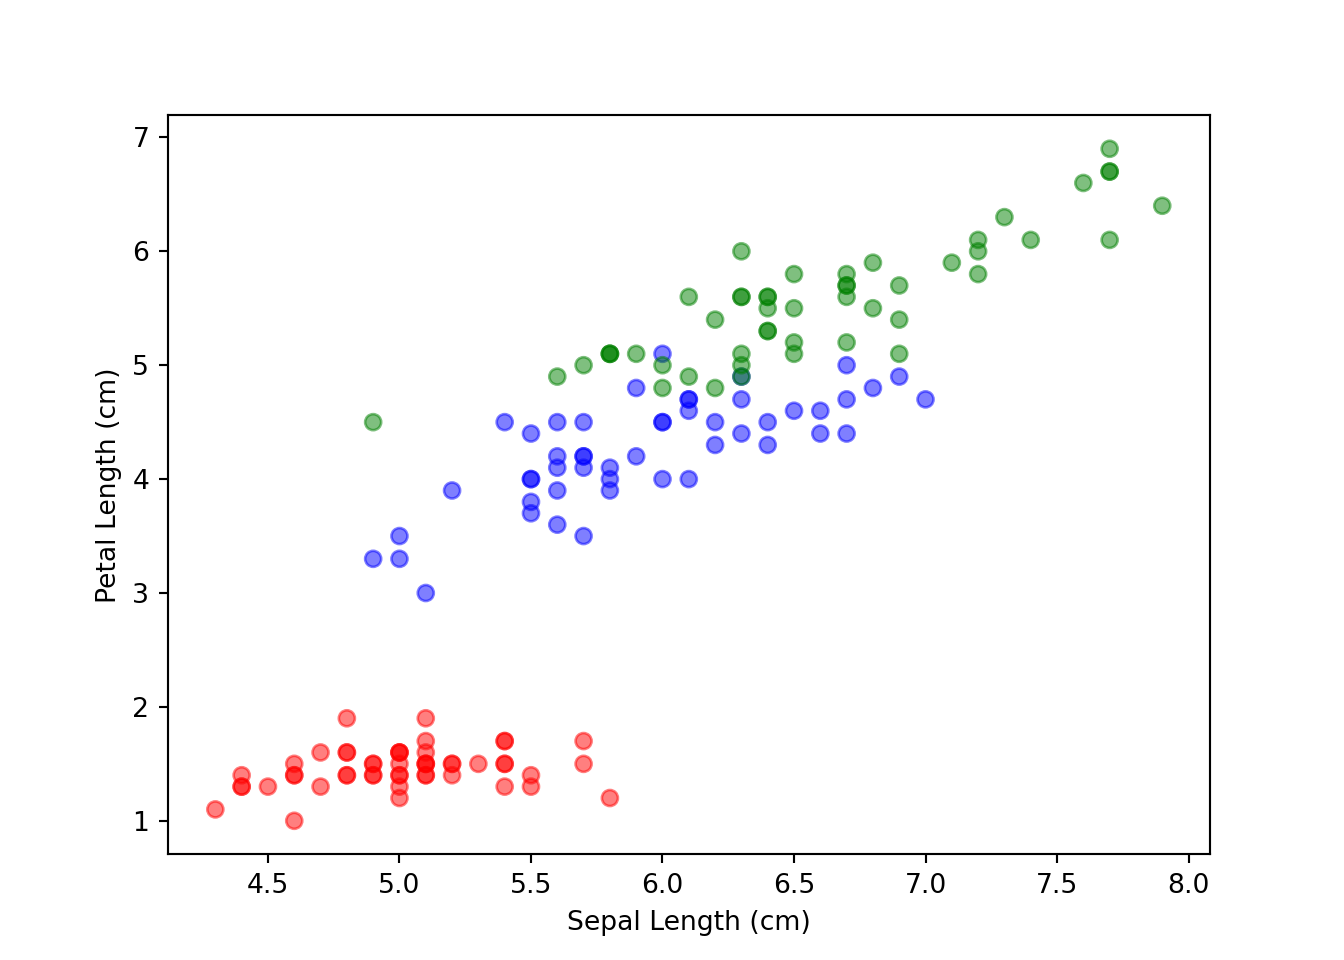
24.3 Components of a Matplotlib Figure
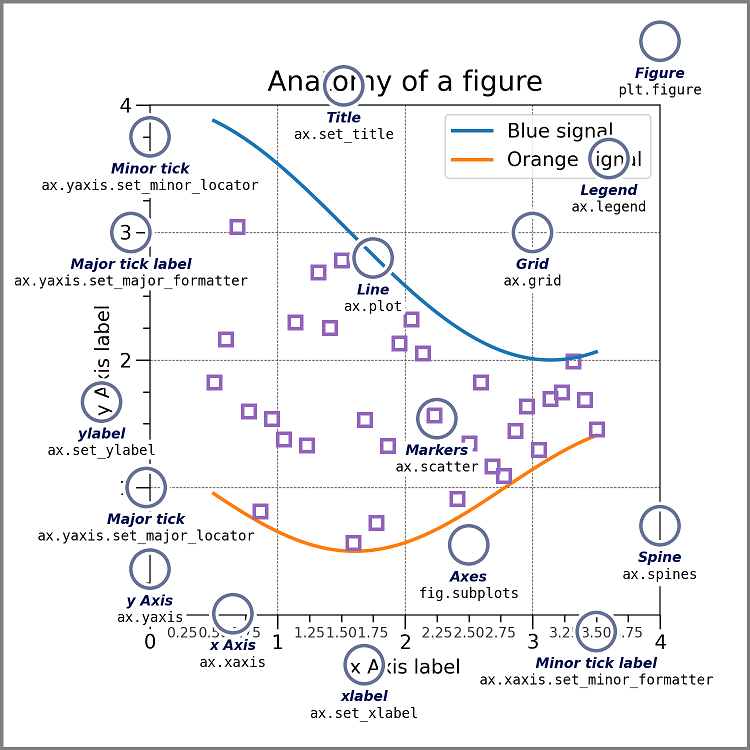
Source: https://matplotlib.org/stable/tutorials/introductory/usage.html