20 R: base plot
-
R
baseplot option creates several plot with very minimal coding. - High-level graphics function creates new plots
- Low-level graphics function annotates plots
- Graphical parameter function change plot parameters
- More elegant plots can be created by changing numerous plot options
20.1 High-level graphics 
| Function | Explanation |
|---|---|
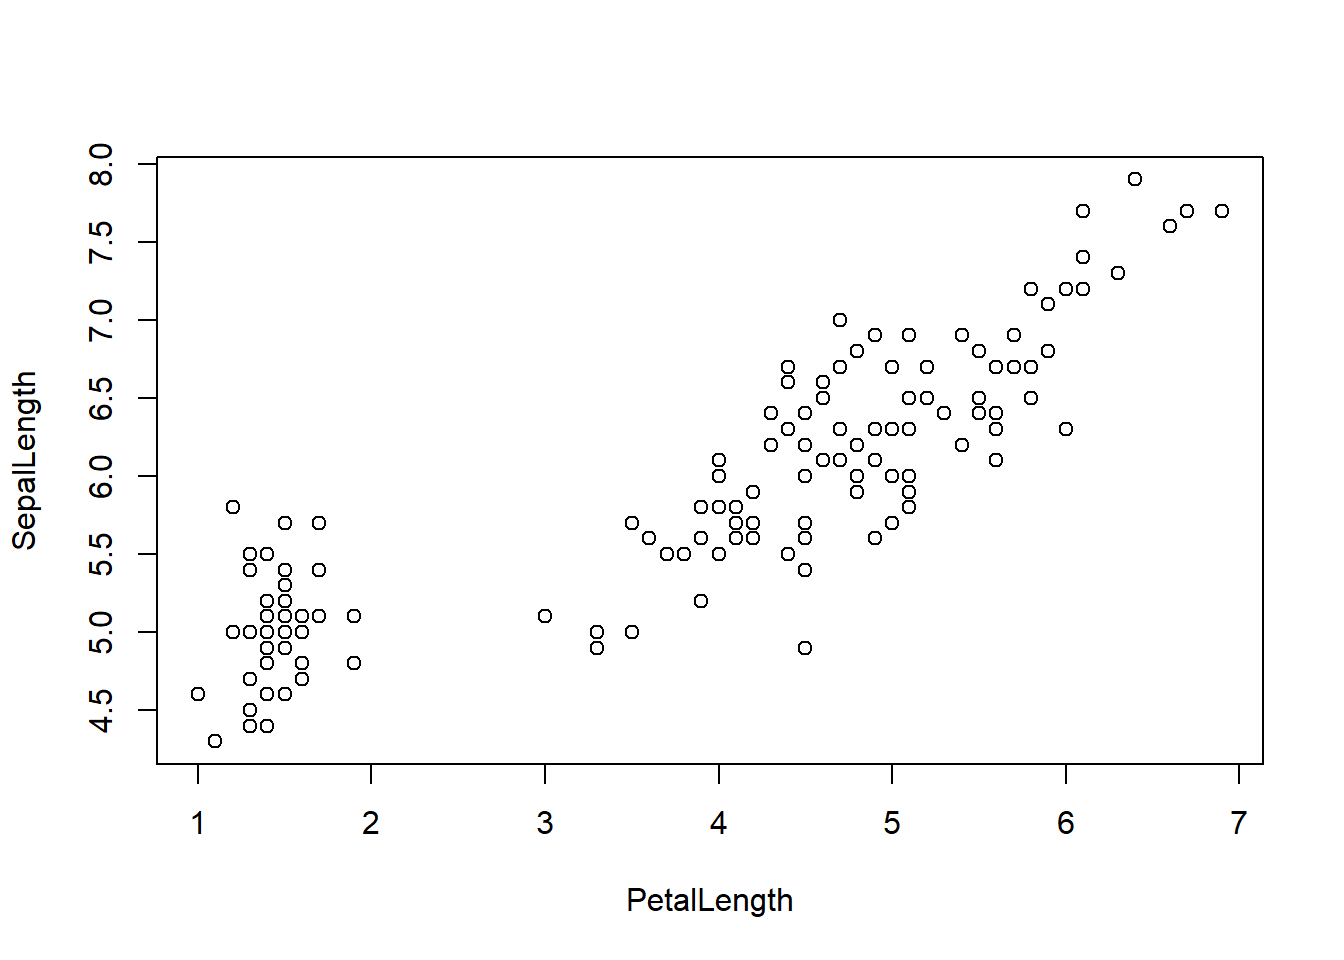
| plot | Scatterplot |
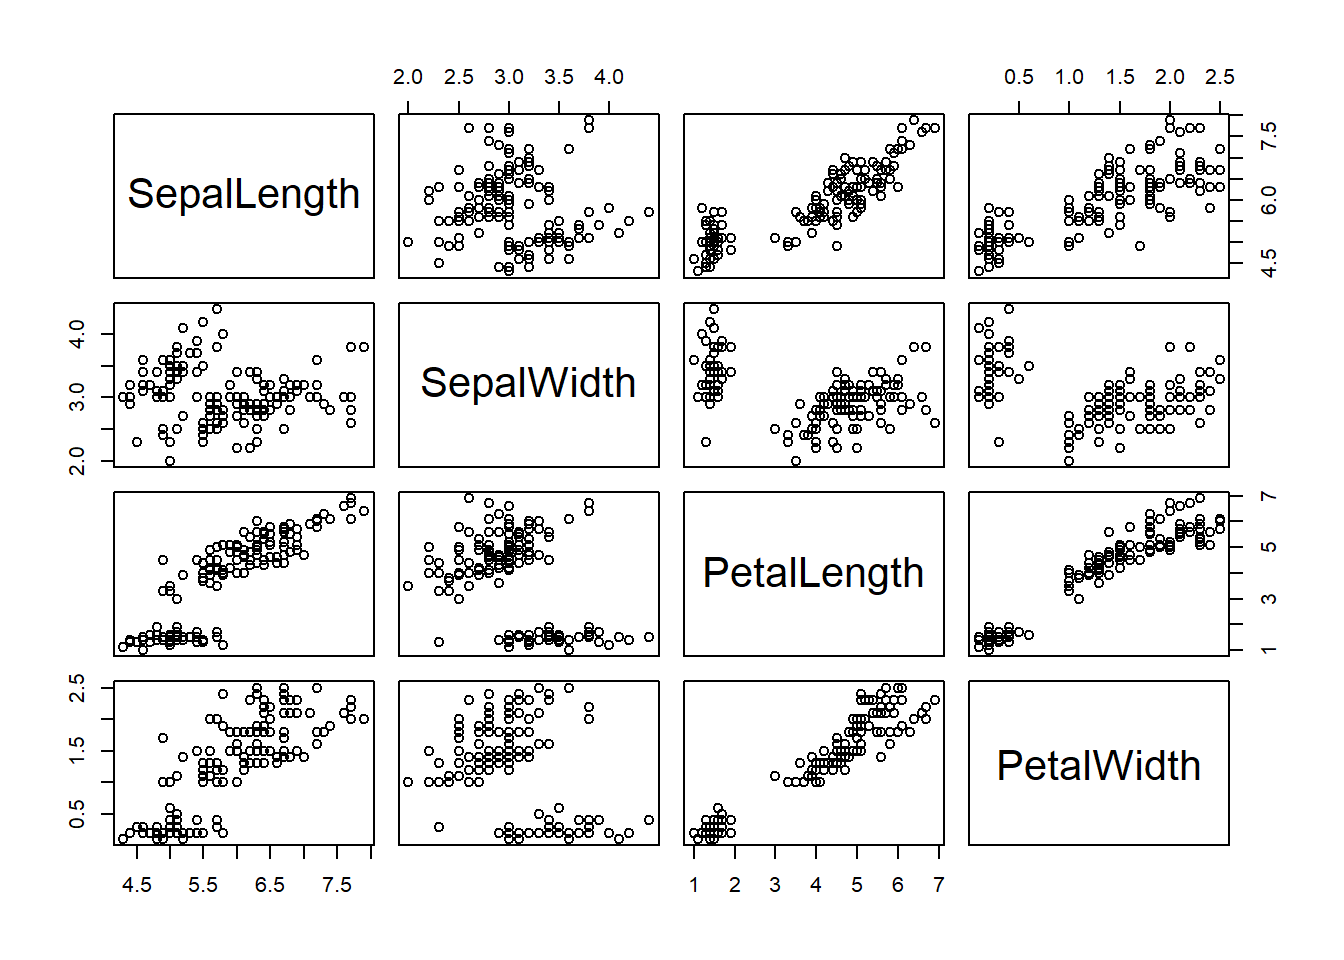
| pairs | Scatterplot matrix |
| coplot | Conditioning plot |
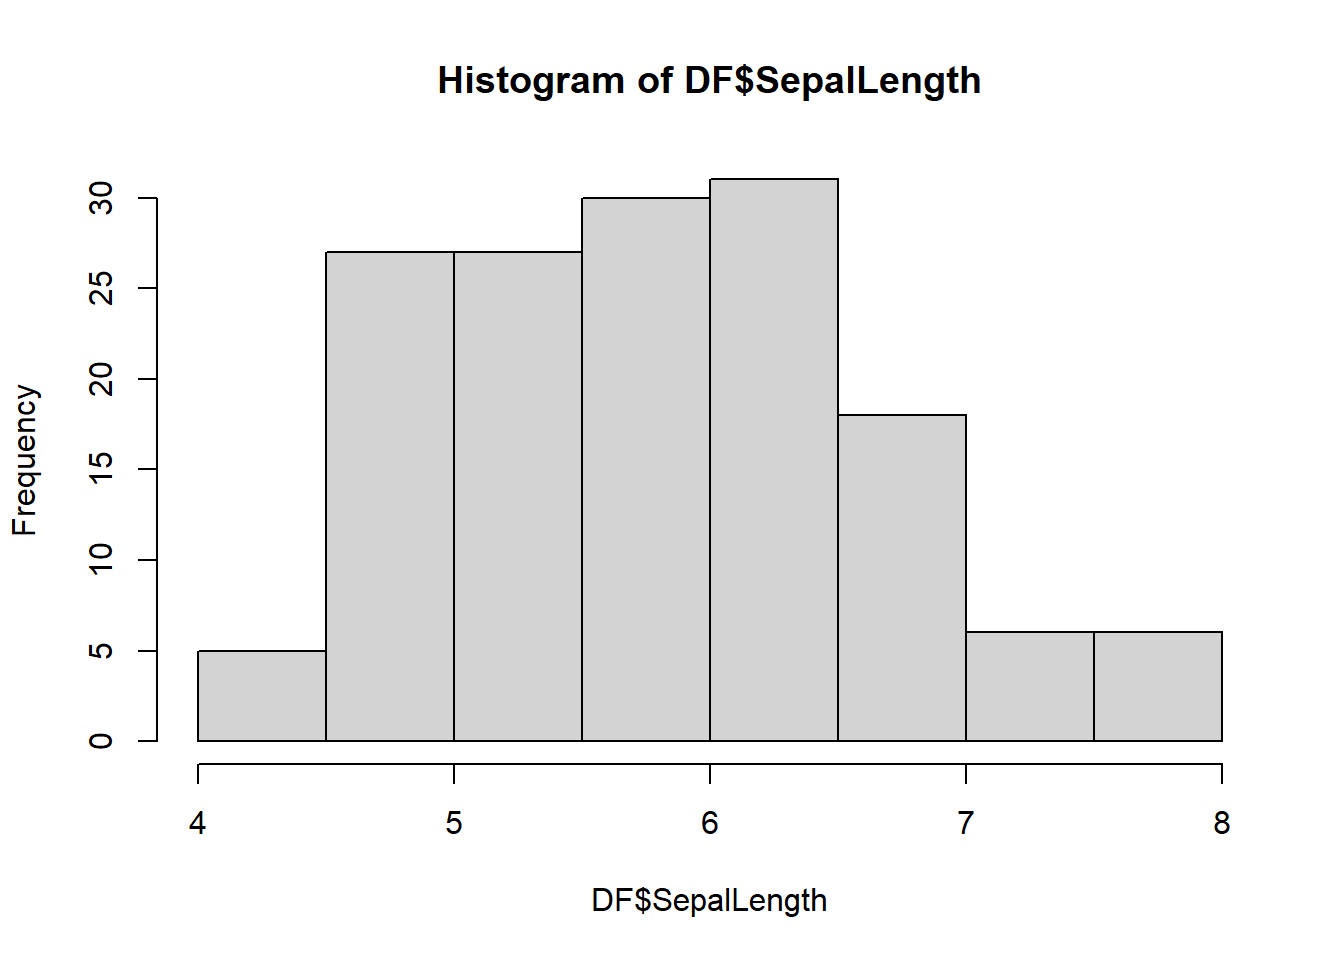
| hist | Histogram |
| stem | Stem-and-leaf plot |
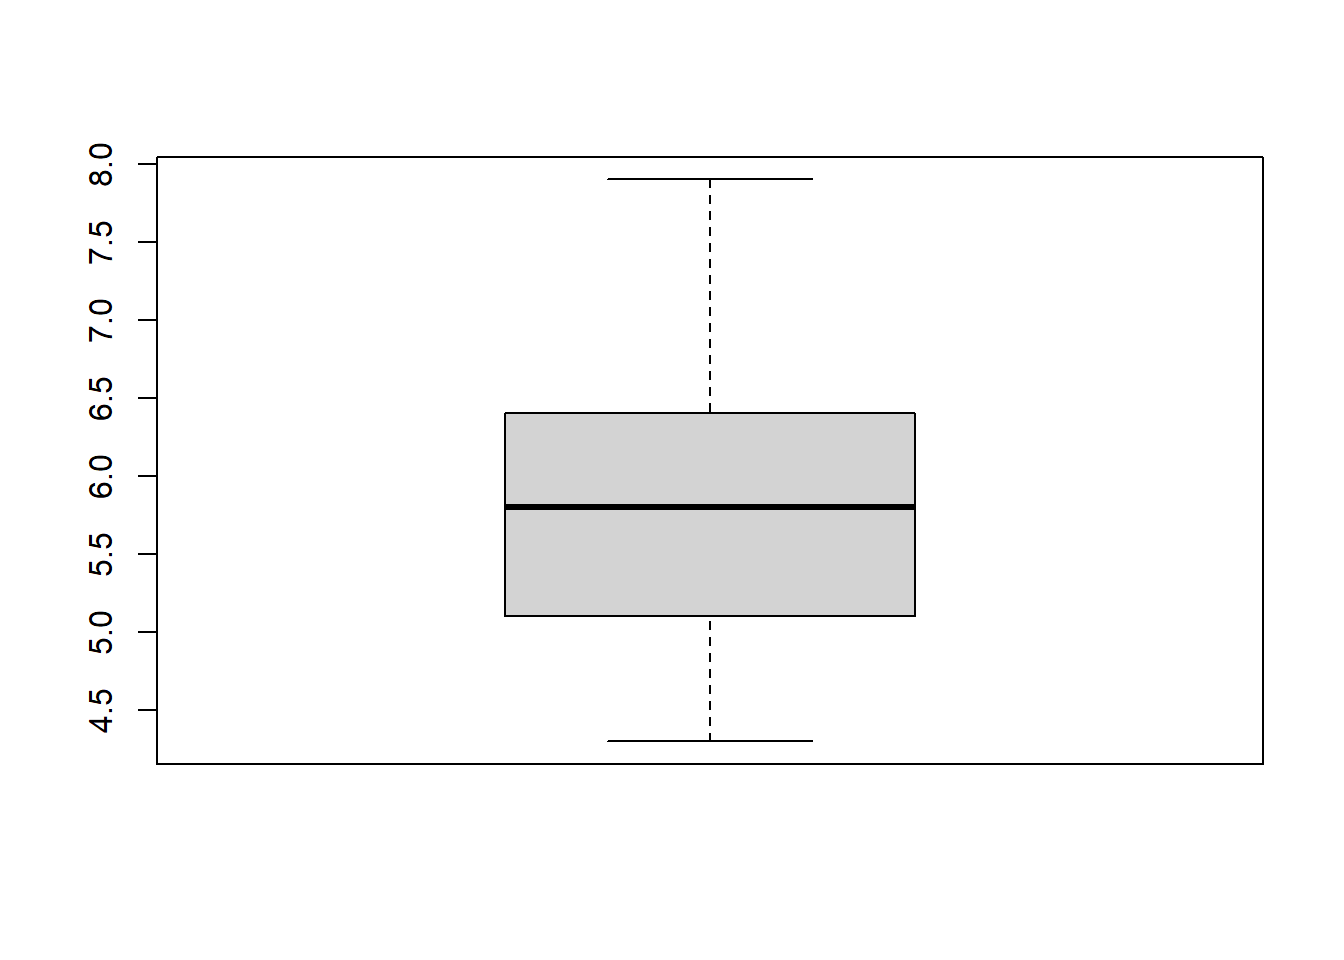
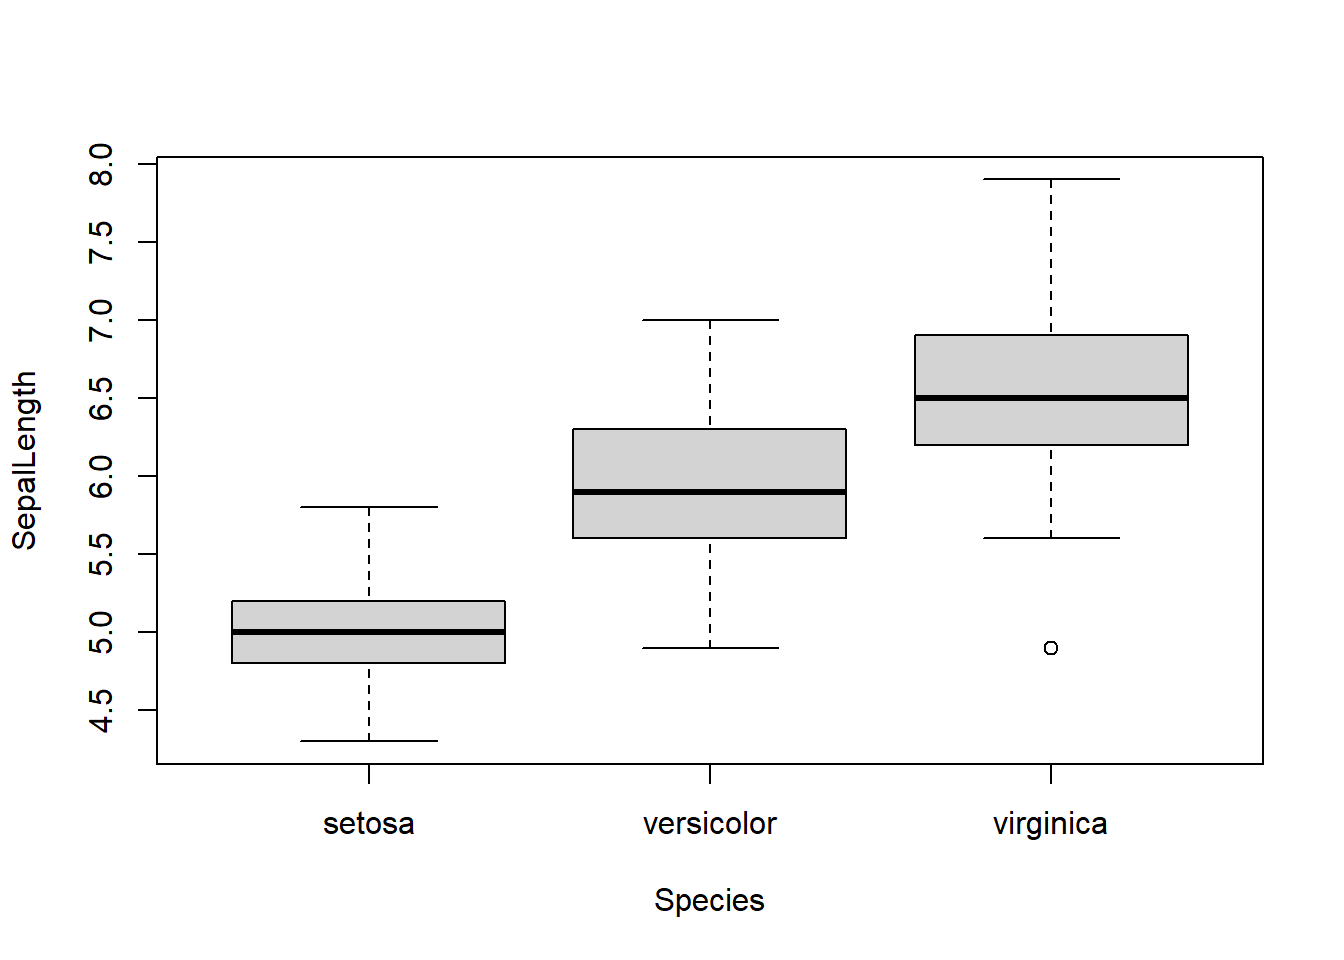
| boxplot | Box-and-whisker plot |
| qqnorm | Quantile-quantile plot |
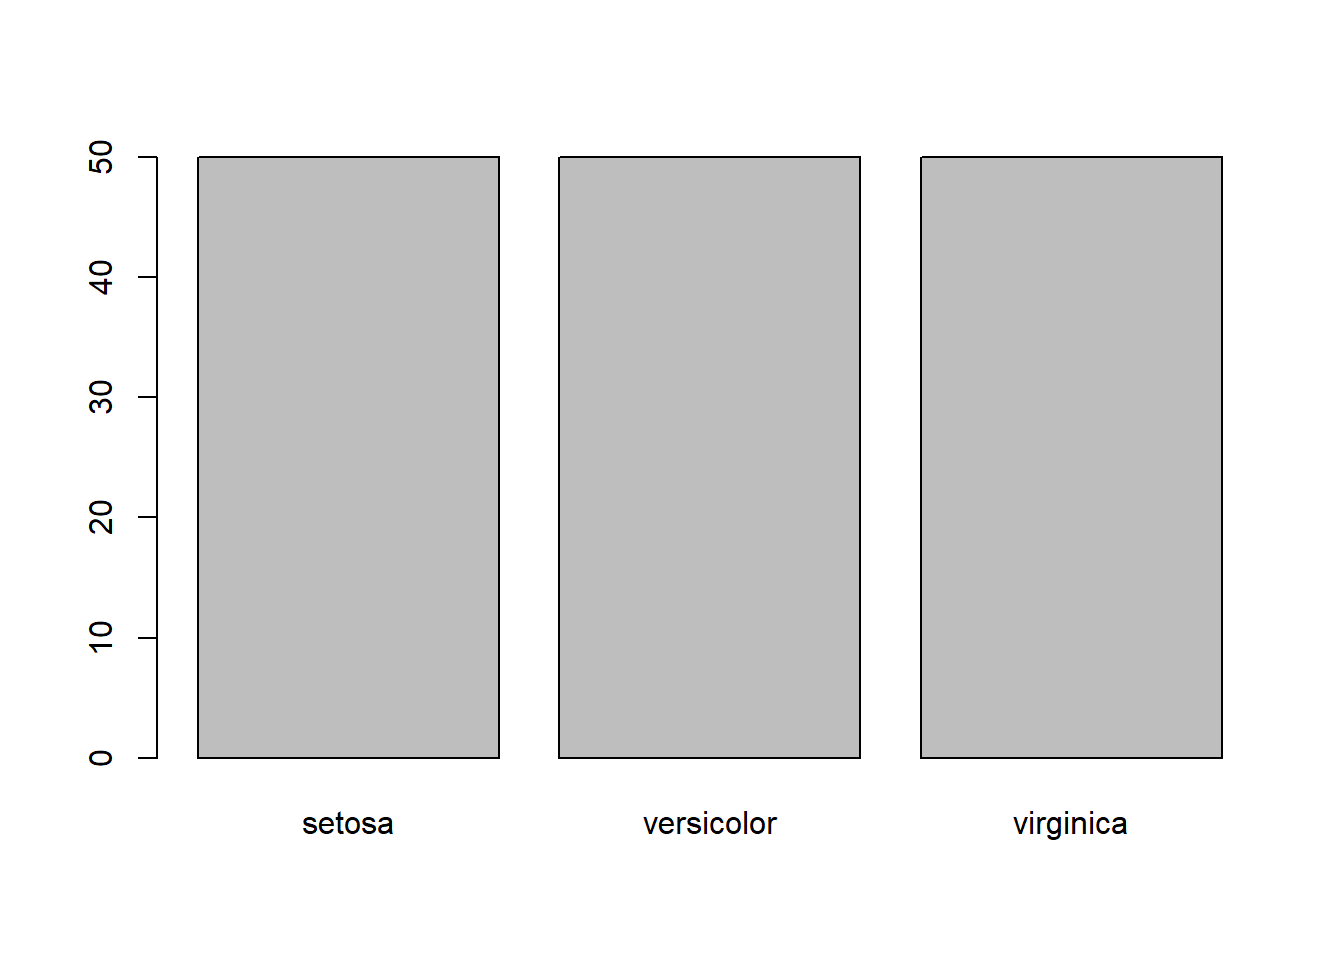
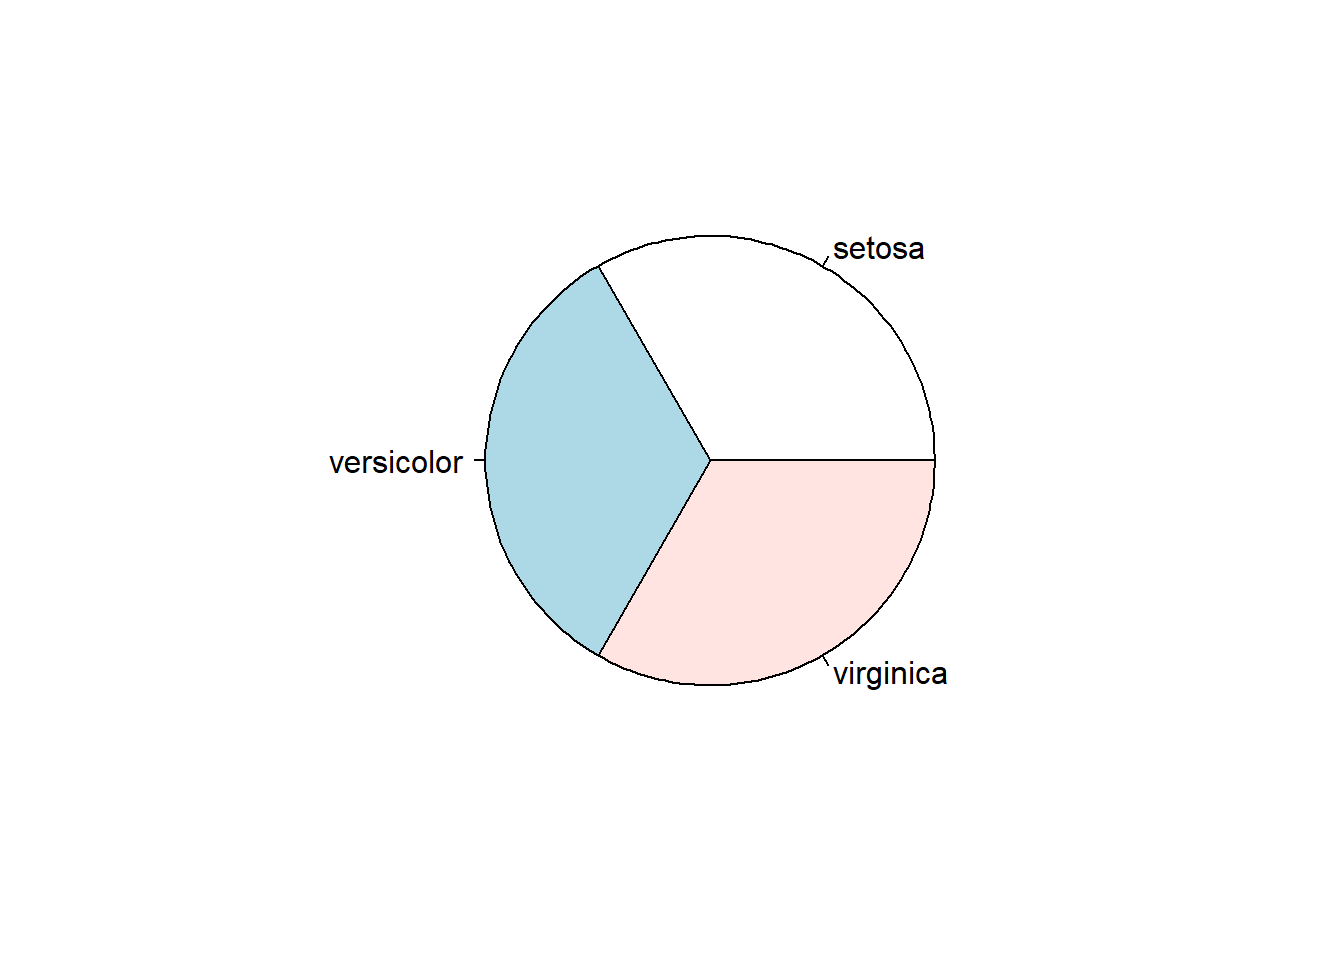
| barplot | Bar plot |
| dotchart | Dot plot |
| interaction.plot | Profile plot of group means |
20.2 Low-level graphics
| Function | Explanation |
|---|---|
| points | Plot points at given coordinates |
| lines | Draw lines between given coordinates |
| text | Draw text at given coordinates |
| mtext | Draw text in the margins of a plot |
| abline | Draw a line of given intercept and slope, or a horizontal and/or vertical line |
| axis | Add an axis |
| arrows | Draw arrows |
| segments | Draw line segments |
| rect | Draw rectangles |
| polygon | Draw polygons |
| box | Draw a box around the plot |
| grid | Add a rectangular grid |
| legend | Add a legend (a key) |
| title | Add labels |
20.3 Graphical parameters
| Function | Explanation |
|---|---|
| main | Title of the plot |
| ylab, xlab | Labels for the y-axis and x-axis |
| ylim, xlim | Limits for the y-axis and x-axis |
| type | Plot type (points, lines, both, …), |
| pch | Plot character (circles, dots, triangles, symbols, …) |
| cex | Character expansion (size of plot characters) |
| lty | Line type (solid, dots, dashes, …) |
| lwd | Line width |
| col | Colour of plot characters |
| las | Orientation of the text on the tick marks |
20.4 Read Data
Set the working directory to the data folder and read the iris dataset as an R object DF.
DF = read.csv('iris.csv')