21 Python: pandas plot
-
Python library
pandasinclude several plot options which is integrated withmatplotlib -
You need to run both
pandasandmatplotlib - The following examples provide a glimpse of some plot options
21.2 Python: Read Data 
Set the working directory to the data folder and read the iris dataset as an R object DF.
import pandas as pd
import numpy as np
import matplotlib.pyplot as plt
DF = pd.read_csv('iris.csv')
Plots are created using pandas with matplotlib
21.3 Single variable
21.3.1 Histogram
DF.hist('SepalLength')array([[<AxesSubplot:title={'center':'SepalLength'}>]], dtype=object)plt.show()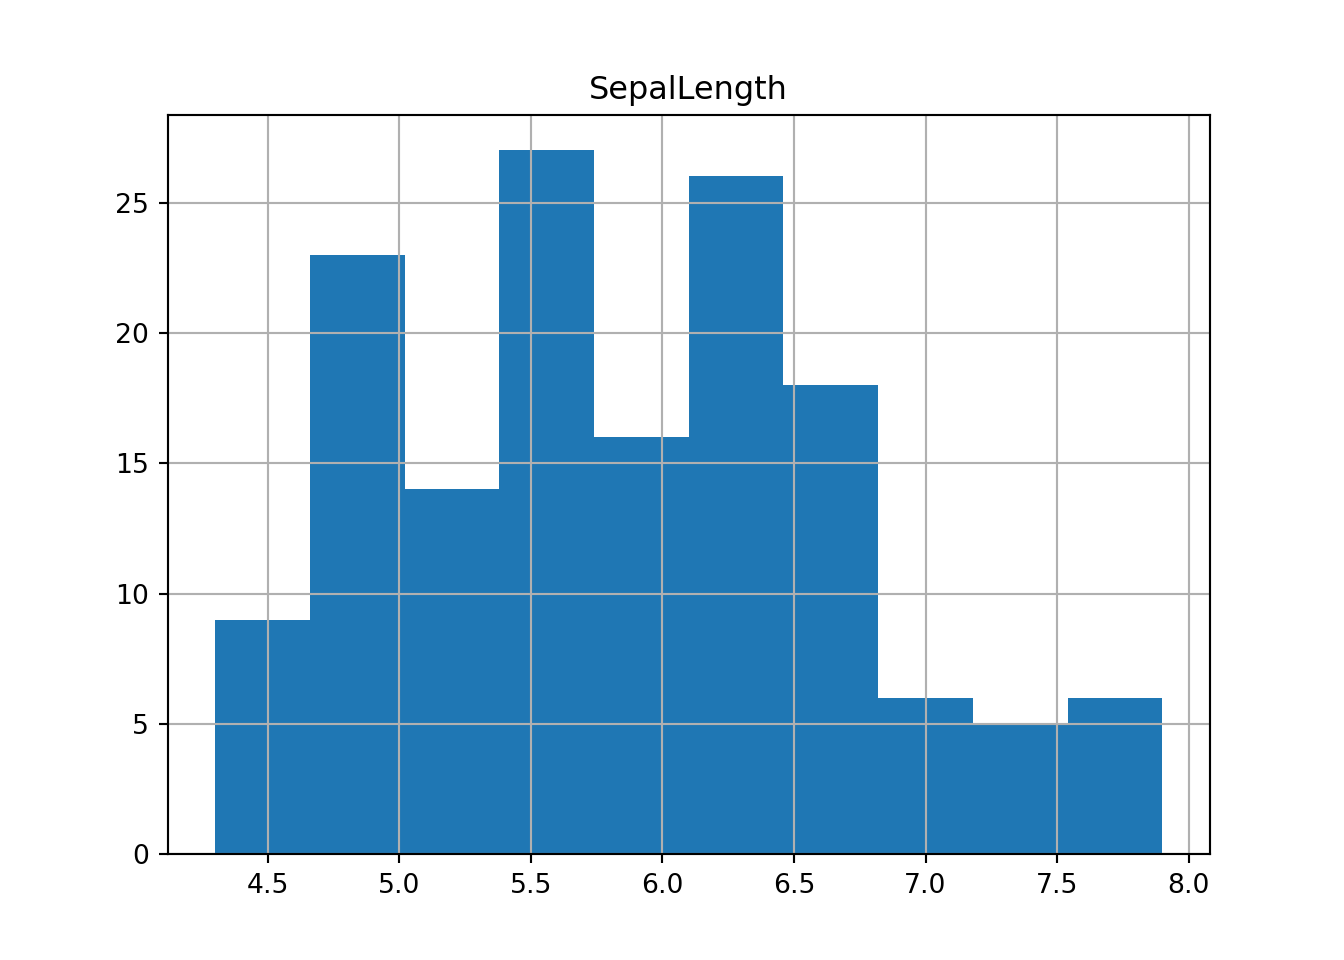
21.3.3 Boxplot
plt.clf()
DF.boxplot(column = 'SepalLength')
plt.show()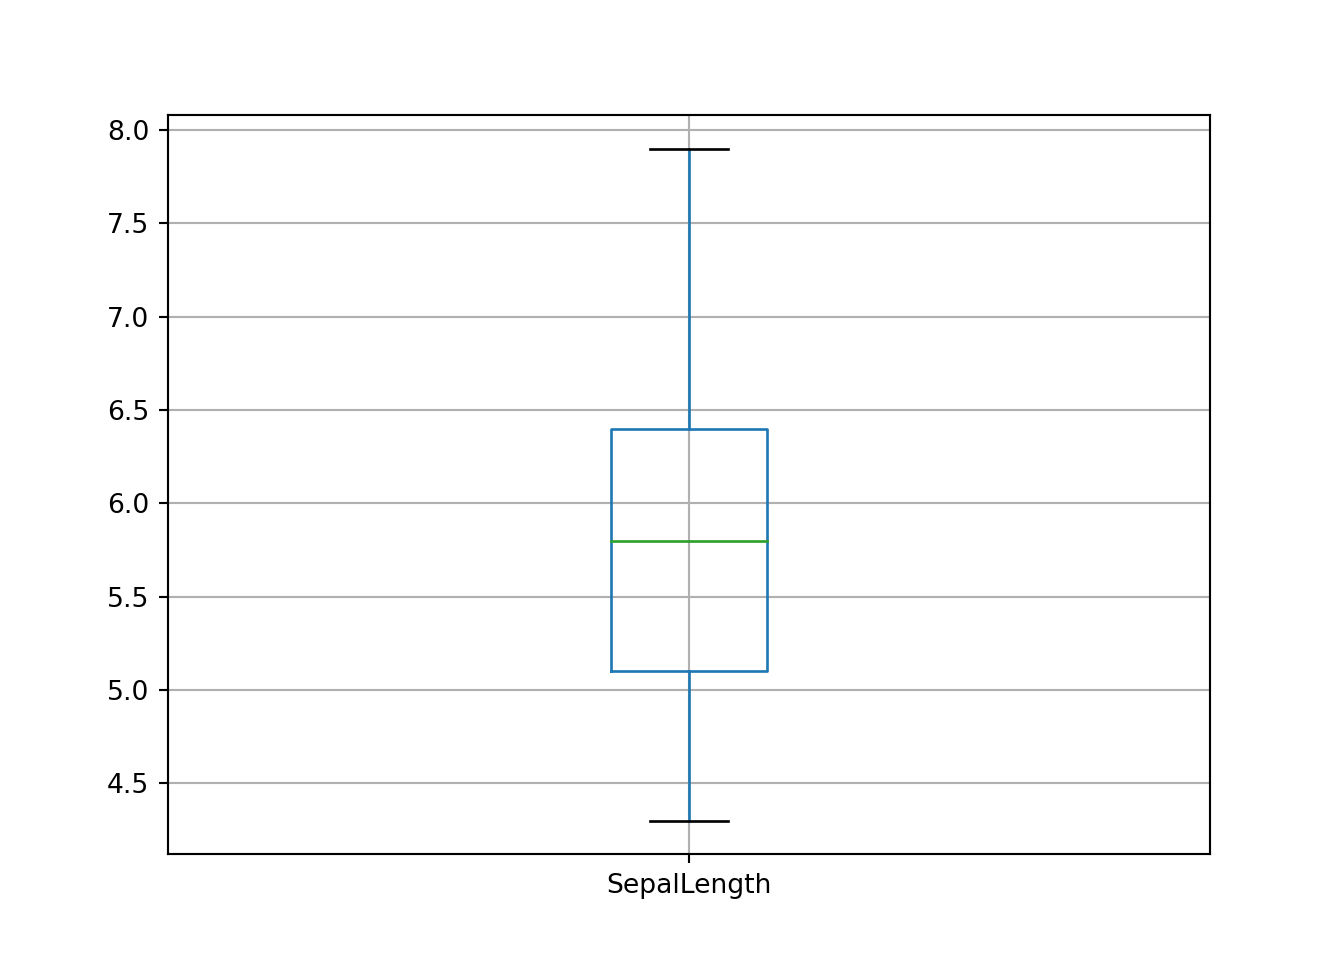
plt.clf()
DF.boxplot()
plt.show()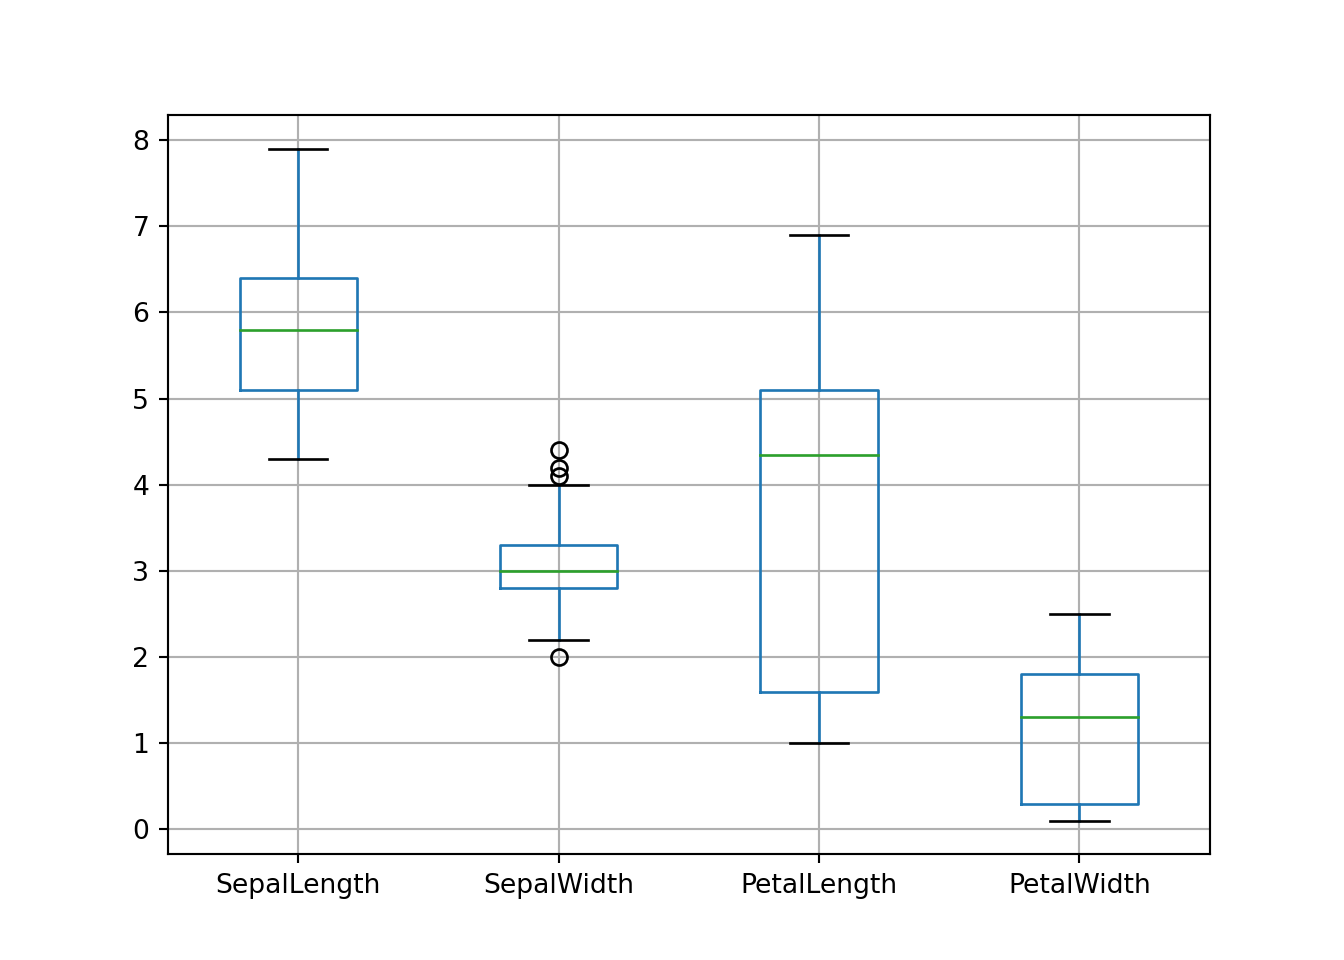
21.4 Multiple variables
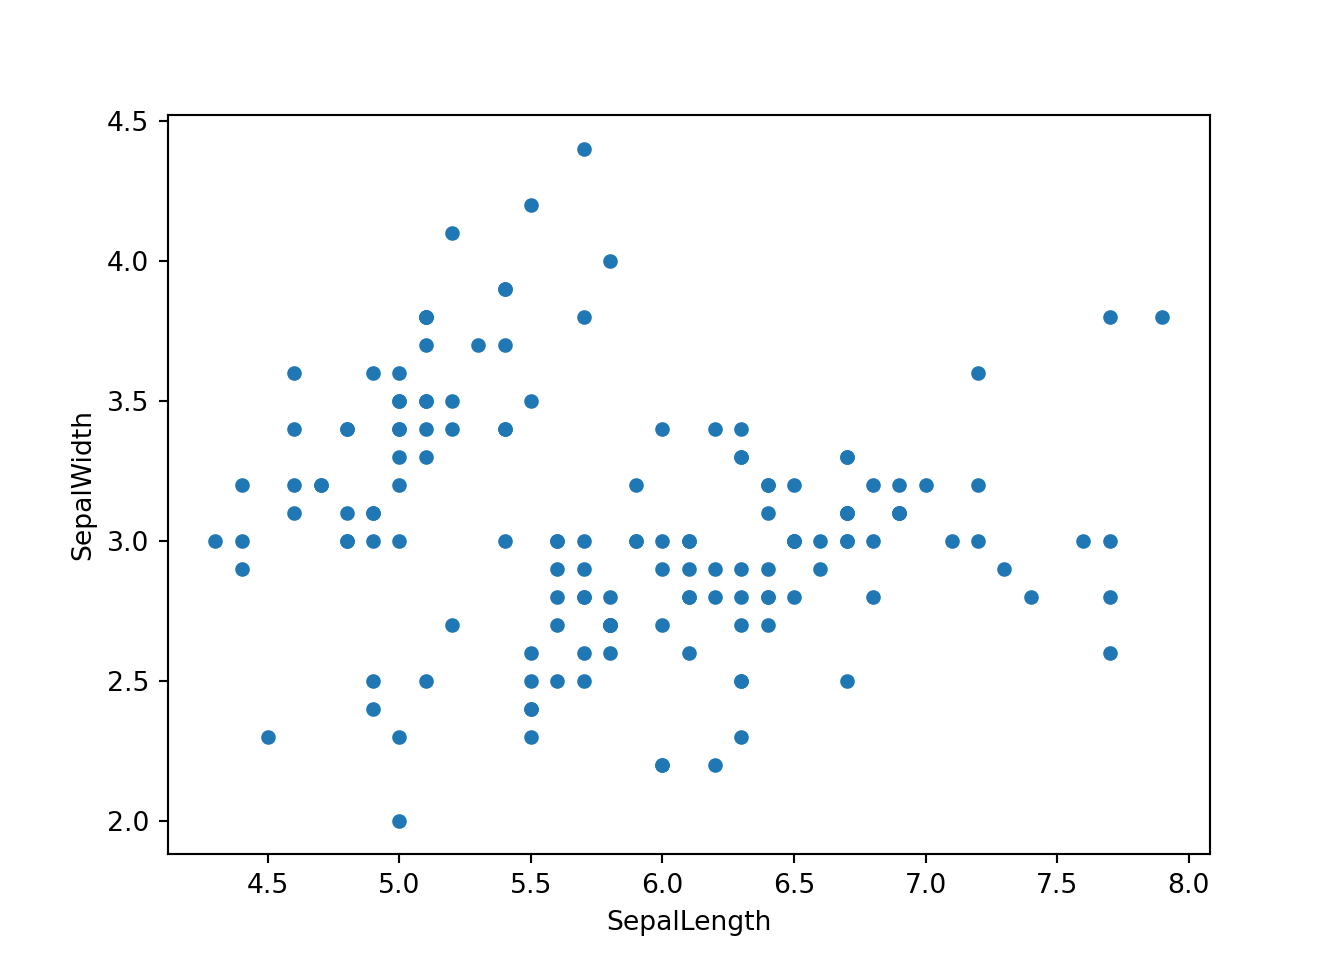
21.4.2 Scatter plot matrix
plt.clf()
pd.plotting.scatter_matrix(DF.iloc[:, 0:4])
plt.show()
array([[<AxesSubplot:xlabel='SepalLength', ylabel='SepalLength'>,
<AxesSubplot:xlabel='SepalWidth', ylabel='SepalLength'>,
<AxesSubplot:xlabel='PetalLength', ylabel='SepalLength'>,
<AxesSubplot:xlabel='PetalWidth', ylabel='SepalLength'>],
[<AxesSubplot:xlabel='SepalLength', ylabel='SepalWidth'>,
<AxesSubplot:xlabel='SepalWidth', ylabel='SepalWidth'>,
<AxesSubplot:xlabel='PetalLength', ylabel='SepalWidth'>,
<AxesSubplot:xlabel='PetalWidth', ylabel='SepalWidth'>],
[<AxesSubplot:xlabel='SepalLength', ylabel='PetalLength'>,
<AxesSubplot:xlabel='SepalWidth', ylabel='PetalLength'>,
<AxesSubplot:xlabel='PetalLength', ylabel='PetalLength'>,
<AxesSubplot:xlabel='PetalWidth', ylabel='PetalLength'>],
[<AxesSubplot:xlabel='SepalLength', ylabel='PetalWidth'>,
<AxesSubplot:xlabel='SepalWidth', ylabel='PetalWidth'>,
<AxesSubplot:xlabel='PetalLength', ylabel='PetalWidth'>,
<AxesSubplot:xlabel='PetalWidth', ylabel='PetalWidth'>]],
dtype=object)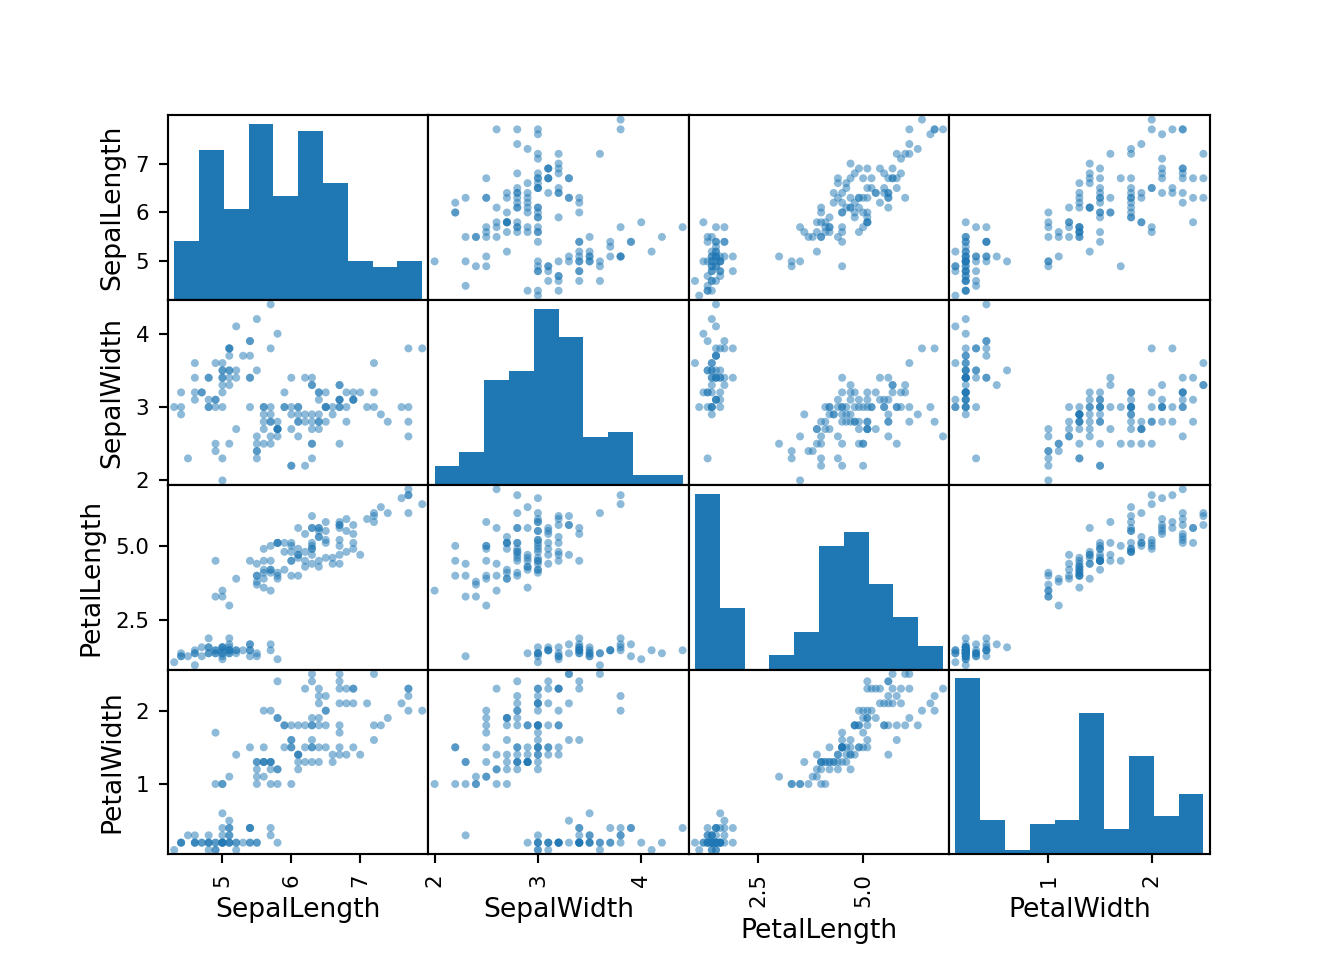
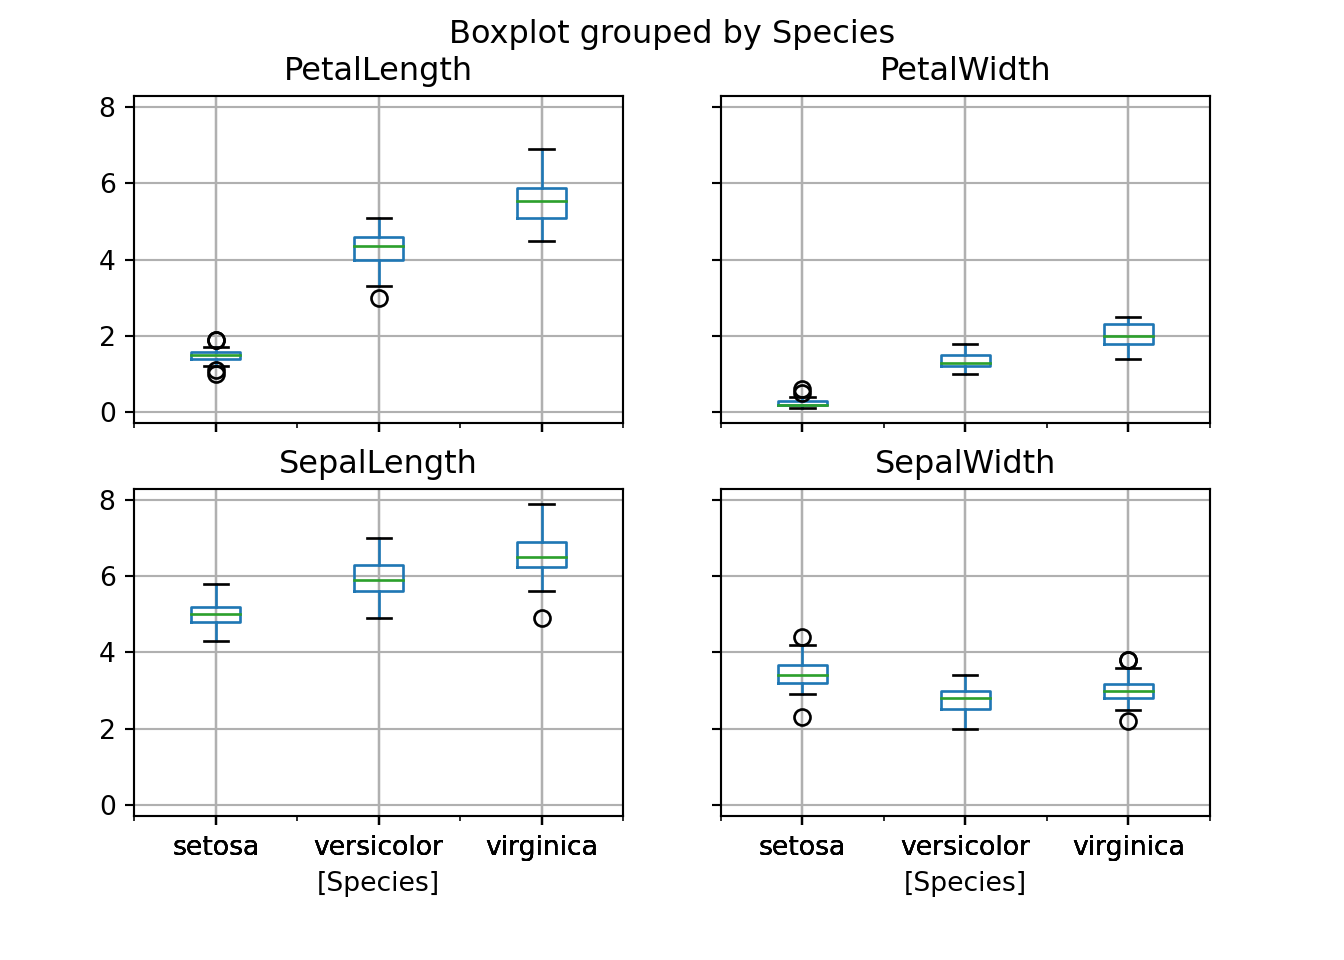
21.4.3 Boxplot
plt.clf()
DF.boxplot(column = 'SepalLength', by = 'Species')
plt.show()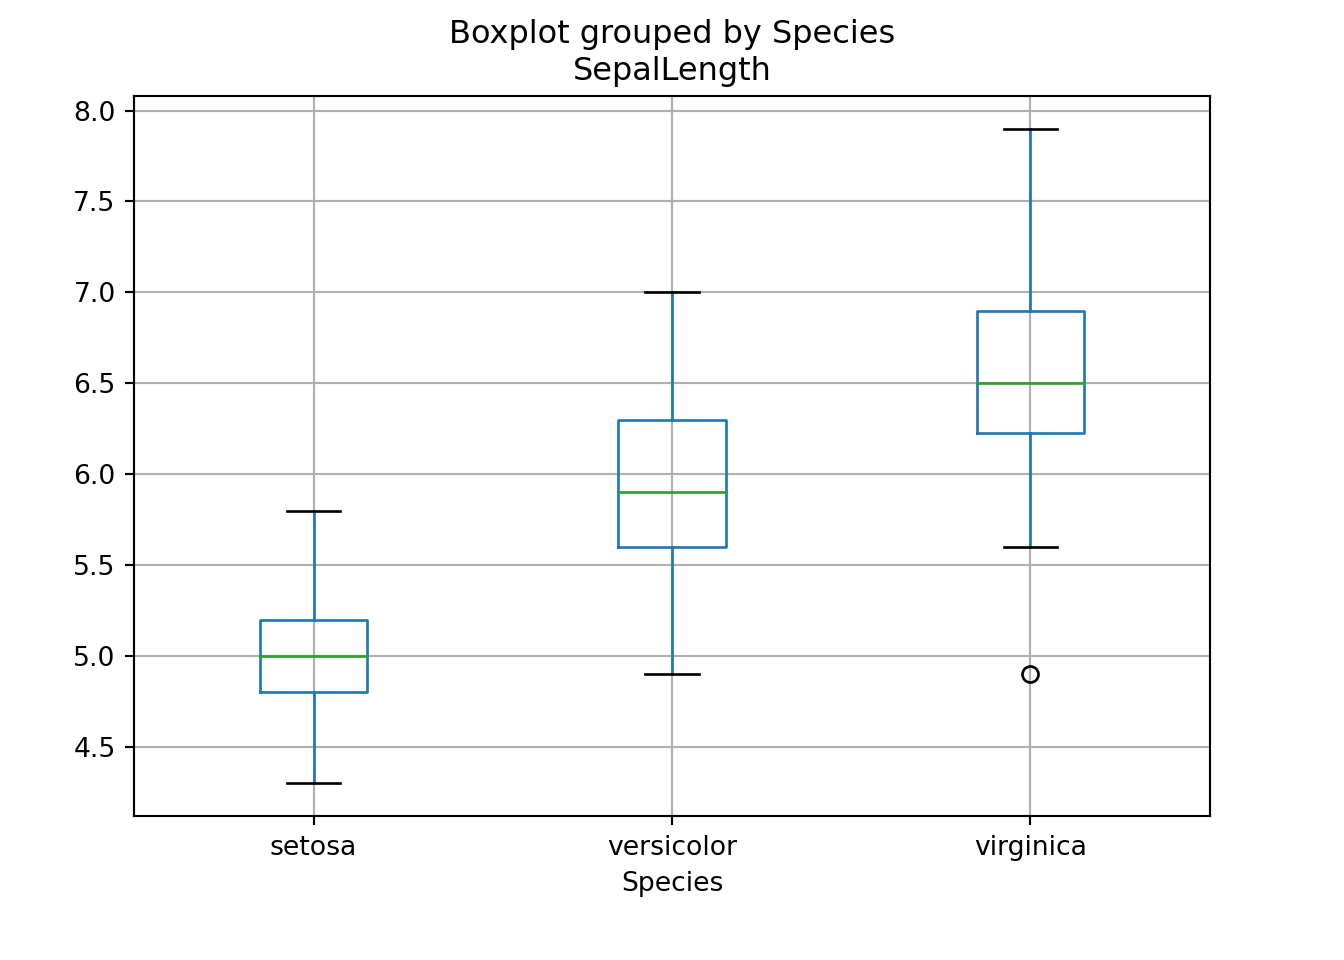
plt.clf()
DF.boxplot(by = 'Species')
plt.show()
array([[<AxesSubplot:title={'center':'PetalLength'}, xlabel='[Species]'>,
<AxesSubplot:title={'center':'PetalWidth'}, xlabel='[Species]'>],
[<AxesSubplot:title={'center':'SepalLength'}, xlabel='[Species]'>,
<AxesSubplot:title={'center':'SepalWidth'}, xlabel='[Species]'>]],
dtype=object)