25 Python: seaborn
-
Library
seabornis a versatile library to create different plots -
Here we provide some examples of
seabornplotting options
25.1 seaborn: Overview
Check the details in the seaborn website:
Install
seabornfromPyPIrepository:pip install seaborn
25.2 Python: Read Data 
Set the working directory to the data folder and read the iris dataset as an R object DF.
import pandas as pd
import numpy as np
import matplotlib.pyplot as plt
import seaborn as sns
DF = pd.read_csv('iris.csv')
25.3 Single variable
25.3.1 Histogram
sns.displot(data = DF, x = 'SepalLength', kind = 'hist', kde = False, bins = 20)
# plt.show()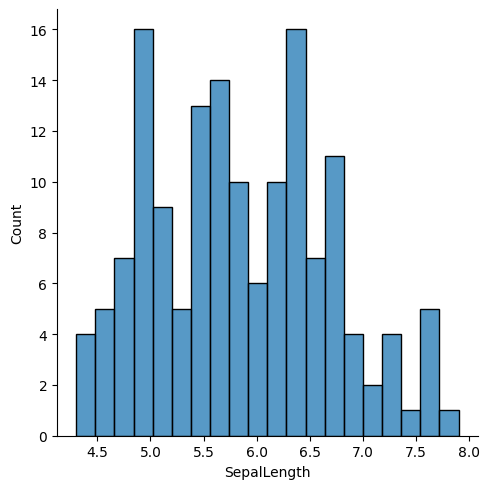
25.3.2 Density plot
plt.clf()
sns.displot(data = DF, x = 'SepalLength', kind = 'hist', kde = True, bins = 20)
# plt.show()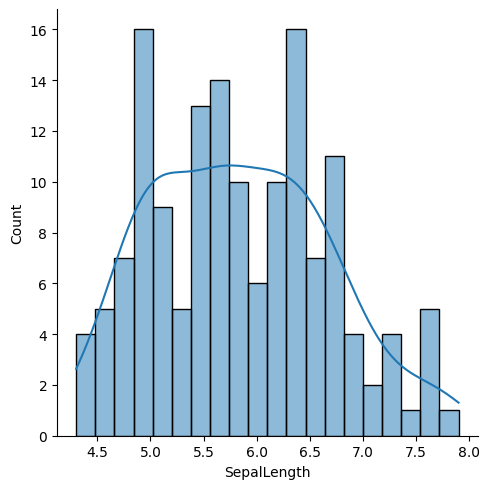
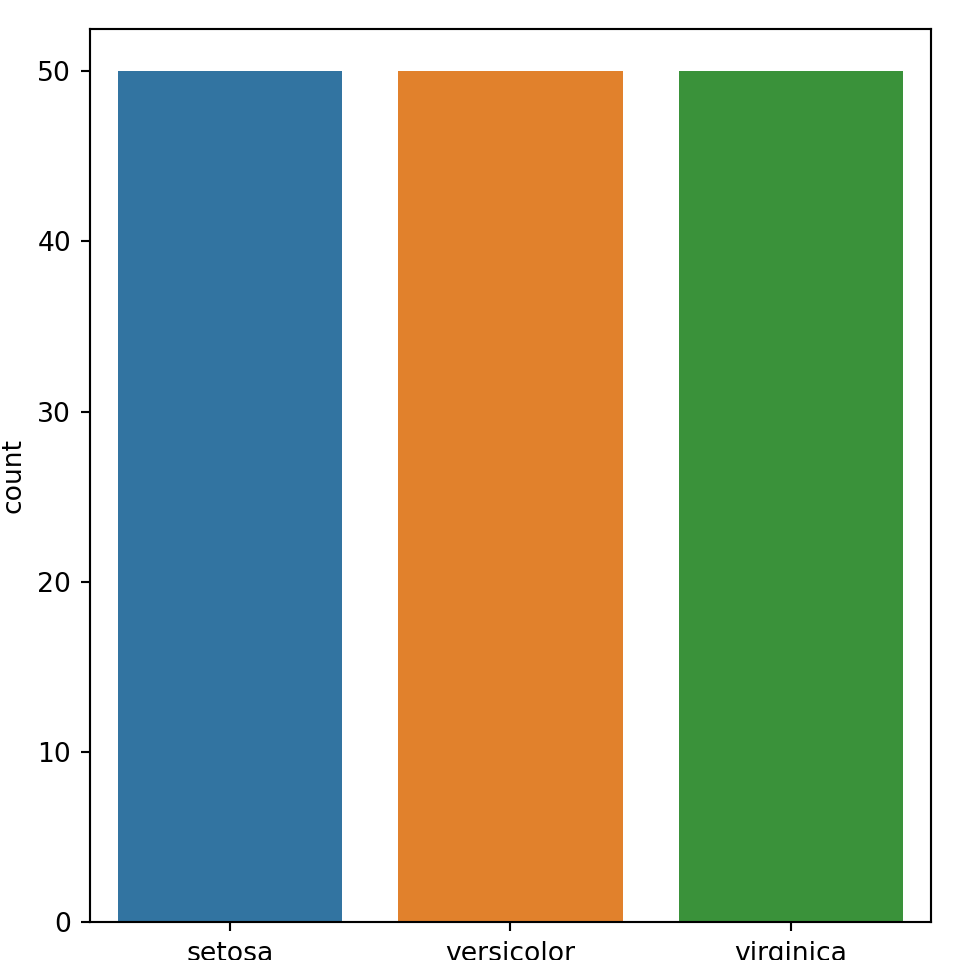
25.3.5 Pie chart
plt.clf()
lab = DF.Species.unique()
cts = DF['Species'].value_counts()
plt.pie(cts, labels = lab)
# plt.show()
([<matplotlib.patches.Wedge object at 0x000001E492EAEBE0>, <matplotlib.patches.Wedge object at 0x000001E492EBA100>, <matplotlib.patches.Wedge object at 0x000001E492EBA5E0>], [Text(0.5499999702695115, 0.9526279613277875, 'setosa'), Text(-1.0999999999999954, -1.0298943258065002e-07, 'versicolor'), Text(0.5500001486524352, -0.9526278583383436, 'virginica')])25.4 Multiple variables
25.4.1 Scatter plot
plt.clf()
sns.relplot(x = 'SepalLength', y = 'SepalWidth', kind = 'scatter', data = DF)
# plt.show()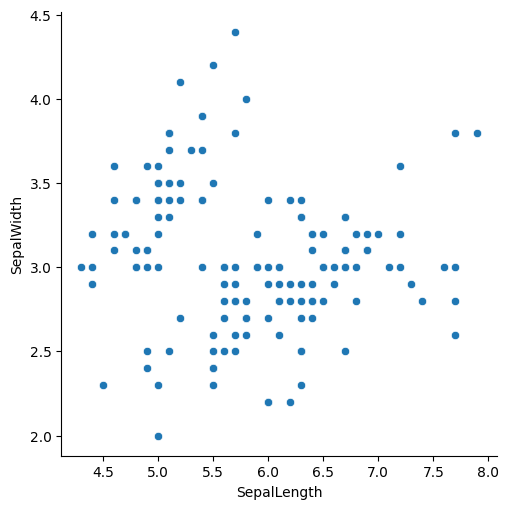
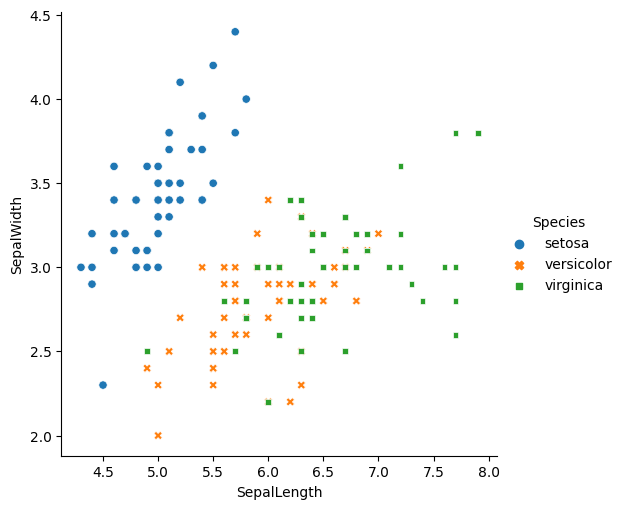
25.4.2 Scatter plot with group
plt.clf()
sns.relplot(x = 'SepalLength', y = 'SepalWidth', kind = 'scatter', hue = 'Species', style = 'Species', data = DF)
# plt.show()