5 Analysis of Paired Data
5.1 Research objective
- To identify if the mean SBP at Week 4 decreased from the baseline value in the Treatment group
5.2 Data
To understand the context, we will use part data to explore this specific objective
Part data are comprised of those in the Treatment group at Week 0 and 4 for GP = 1 only
Figure: A schematic representation of the data structure considered in this section
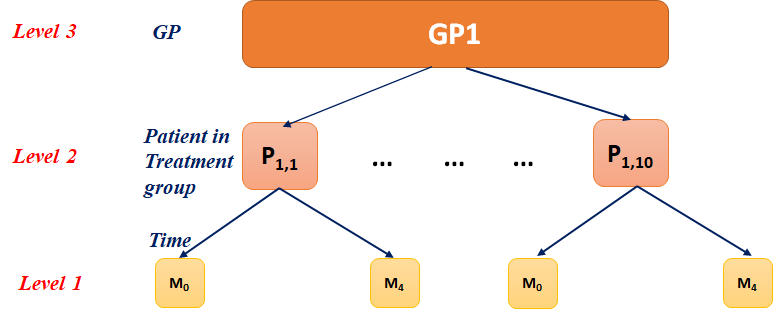
The table includes the data from all patients
5.3 Data Summary: Plot
5.4 Data Summary: Table
| Time | N | Mean | SD |
|---|---|---|---|
| 0 | 10 | 146 | 9.10 |
| 4 | 10 | 135 | 7.26 |
5.5 Model equation
Let’s try to develop a statistical model for the given experiment.
\[diff_{i} = \beta_1 + e_{i}\]
Here:
\(diff_{i}\) = the difference in SBP value of the i-th patient (\(i = 1, ..., 10\)) between week 4 and week 0
\(\beta_1\) = the estimated mean difference of mean SBP
\(e_{i}\) = the random error corresponding to the measurement of the i-th patient
Assumptions of the above model:
\(e_{i} \sim N(0, \sigma_e^2)\)
5.6 Hypothesis
\[Null \space hypothesis, H_0: \beta_1 = 0\]
\[Alternative \space hypothesis, H_1: \beta_1 \ne 0\]
5.7 Incorrect analysis: Summary
INCORRECT analysis of the data considering SBP at Time 0 and 4 weeks are independent observation.
INCORRECT results using the independent sample t-test.
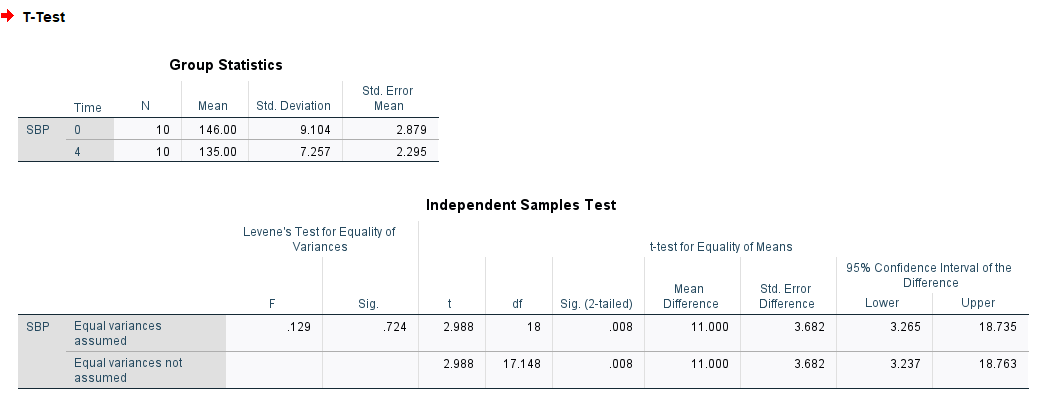
Note the estimated difference, SE, t-statistic, degrees of freedom and p-value.
5.8 CORRECT analysis
CORRECT analysis of the data considering observed SBP at Time 0 and 4 weeks on the same patients are paired.
CORRECT analysis accounts for the paired data using the paired sample t-test.
The paired sample t-test calculates the difference of SBP at week 0 and week 4 and then conduct paired sample t-test on the difference.
5.9 Correct analysis: Summary
DATASET ACTIVATE DataSet1.

T-TEST PAIRS=SBP0 WITH SBP4 (PAIRED)
  /ES DISPLAY(TRUE) STANDARDIZER(SD)
  /CRITERIA=CI(.9500)
  /MISSING=ANALYSIS.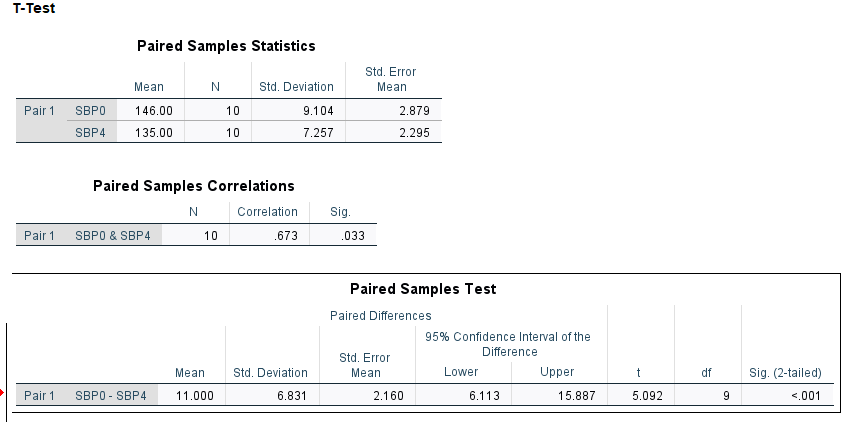
Note the estimated difference, SE, t-statistic, degrees of freedom and p-value from the paired t-test.
The correct approach identifies that the data consist of 10 patients, and hence the degrees of freedom equal to (10 - 1).