3 Data: Systolic Blood Pressure
3.1 Experiment
A clinical trial recruited 20 Patients (ID) in one GP
The trial was also replicated in 5 General Practitioners (GP), however, to keep it simple we will just investigate the data from a single GP.
Half of the patients within each GP were randomly allocated to one of the two Groups: Treatment (a new drug that helps in reducing the blood pressure) and Control (the existing drug)
Each patient had Systolic Blood Pressure (SBP) measurement (mmHg) at five time points (Time (week)): at the baseline (Week 0) and every week for four weeks (Weeks 1 to 4)
Other patient-level covariates were also measured: Age (year), Sex (Male & Female) and BMI at the baseline
As a part of the clinical trial protocol, all patients were required to follow certain prescribed lifestyle guidelines to control for other extraneous known factors that may affect the SBP variability.
3.2 Data description
GP: ID of General Practitioners (GP) (only one GP data used for the current example)
ID: ID of Patients (n = 20)
Age: Age (year) of the patient in years at the baseline (continuous variable)
Sex: Sex of the patient (Two levels: Female & Male)
BMI: BMI measured at the baseline (continuous variable)
SBP: Systolic Blood Pressure (SBP) measurement (mmHg) at the baseline (SBP0) and four weekly time points (SBP1 to SBP4)
Time: Weekly time points from 0 (baseline) to 4 (week)
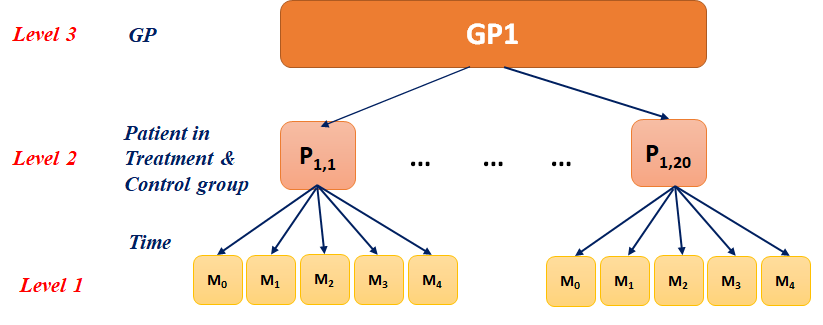
3.3 Data structure
Level 1: Observation of each patient at each time point
Unit of analysis
Response variable: Systolic Blood Pressure (SBP) in mmHg
Predictor variables at Level 1: Baseline SBP, Age (year), Sex, BMI, Time (week)
Level 2: Patient
Response variable: Systolic Blood Pressure (SBP)
Predictor variable at Level 2: Treatment
Level 3: GP
Response variable: Systolic Blood Pressure (SBP)
Predictor variable at Level 2: Deprivation index (note, we have not recorded it here)
Figure: A schematic representation of the clinical data structure described above
3.4 Data
A snapshot of the data in wide format is presented here.