2 Data Structure for LMM
2.1 Data Examples
Patients data: Region, Health Board, Council, GP, Patients
School data: Area or Region, School, Class, Student
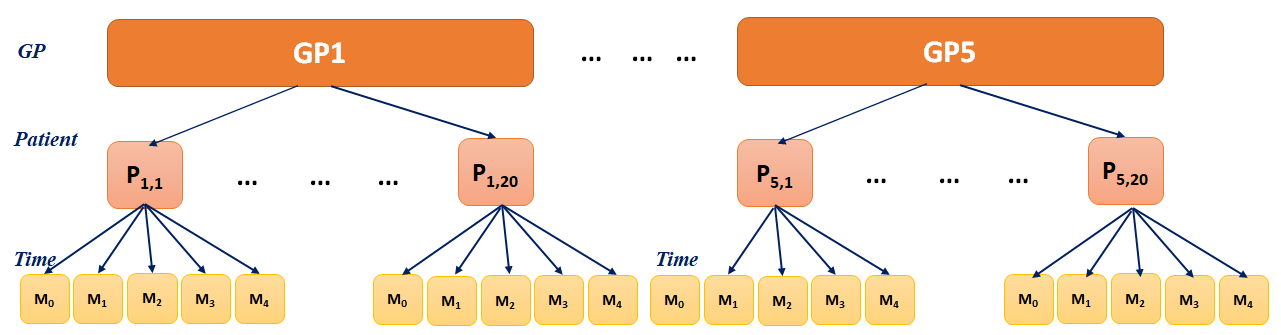
Repeated measures: GP, Patient, Multiple time points
See illustration below and note the structure of these different datasets
2.2 Data source
Complex experimental designs
Clinical trial
Repeated measures data
Longitudinal data
Clustered longitudinal data
Spatial data
Nested or Hierarchical data
Cross-classified data
These datasets are characterised by multiple strata or clusters where observations within a stratum are correlated
2.3 Data levels
Level 1:
- The lowest level of data, usually the units of analysis in the study
- The continuous response variable is always measured at Level 1
- Example: Marks obtained by a student in the Math exam
Level 2:
- The second level in the hierarchy
- Level 2 observations represent the cluster of units
- Example: Class representing units of students
Level 3:
- The third level in the hierarchy
- Level 3 observations represent the cluster of Level 2 units
- Example: School representing units of classes
We measure continuous and categorical variables at different levels of the data and refer the variables as Level 1, 2 or 3 variables.
2.4 Illustration
Figure: Clustered data where individuals within a cluster are more likely to have similar measurements of the response variable
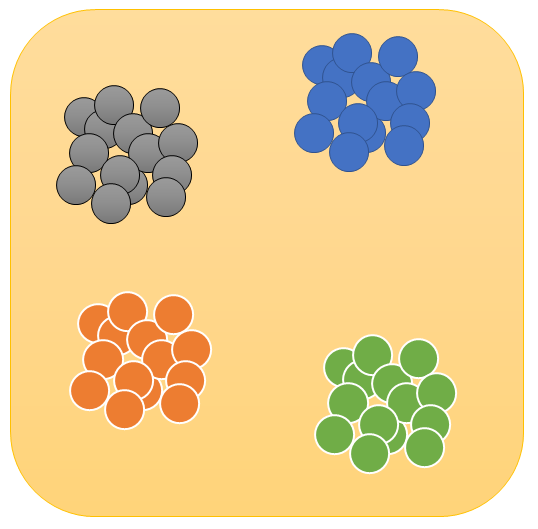
Figure: School data showing hierarchical or nested structure, also called multilevel structure
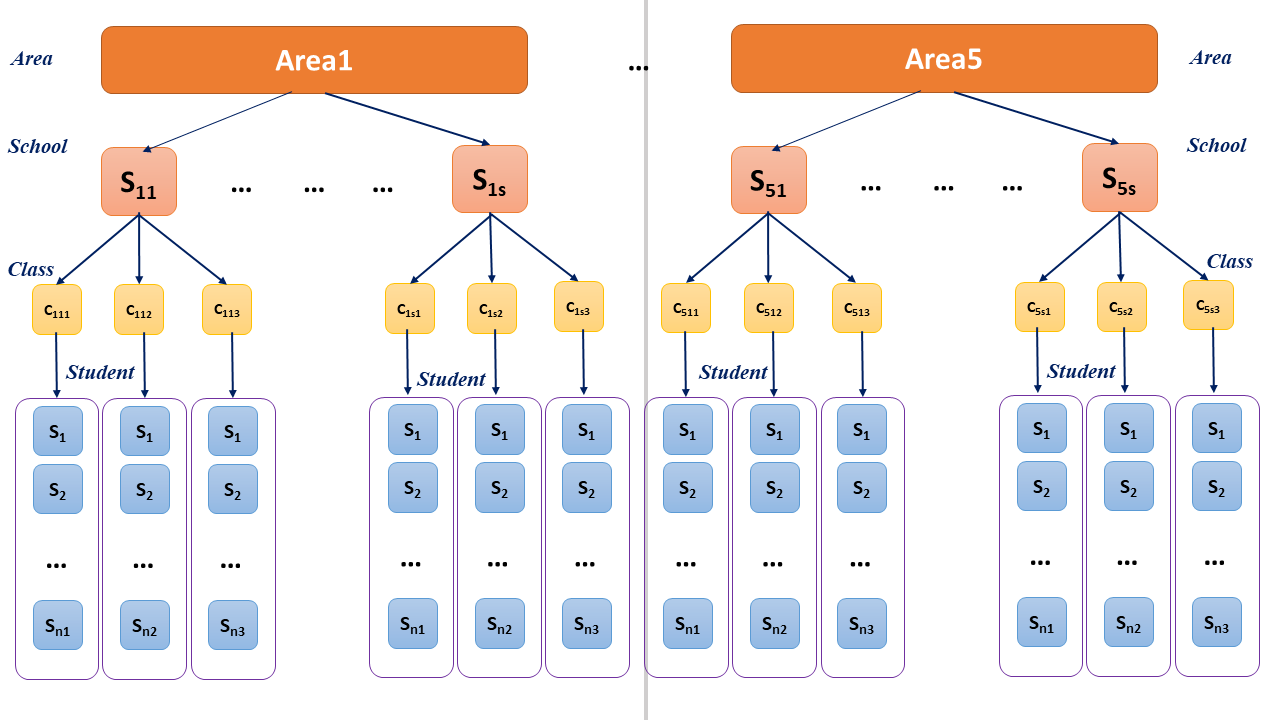
Figure: Repeated measures data where multiple measurements are recorded on each individual patient
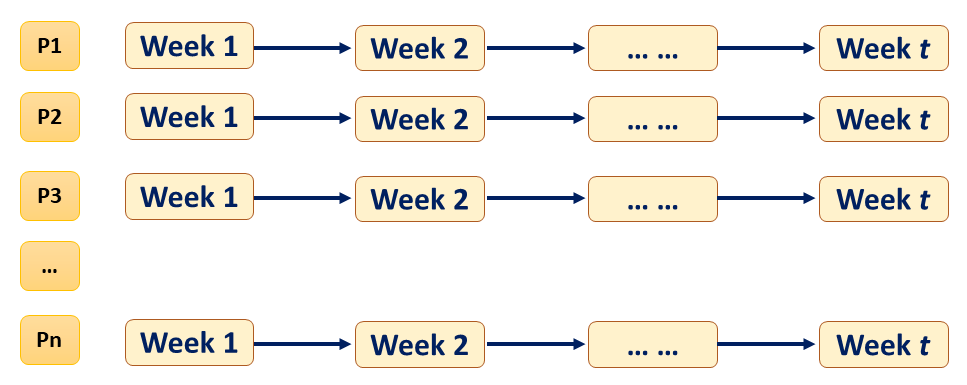
Figure: Patient data showing hierarchical or nested structure at Area, GP and Patient level