Section 22 Compare t.test & lm outputs
22.1 t.test output
\[ \large t.test(SBP \sim Group, \space data=pBP) \]
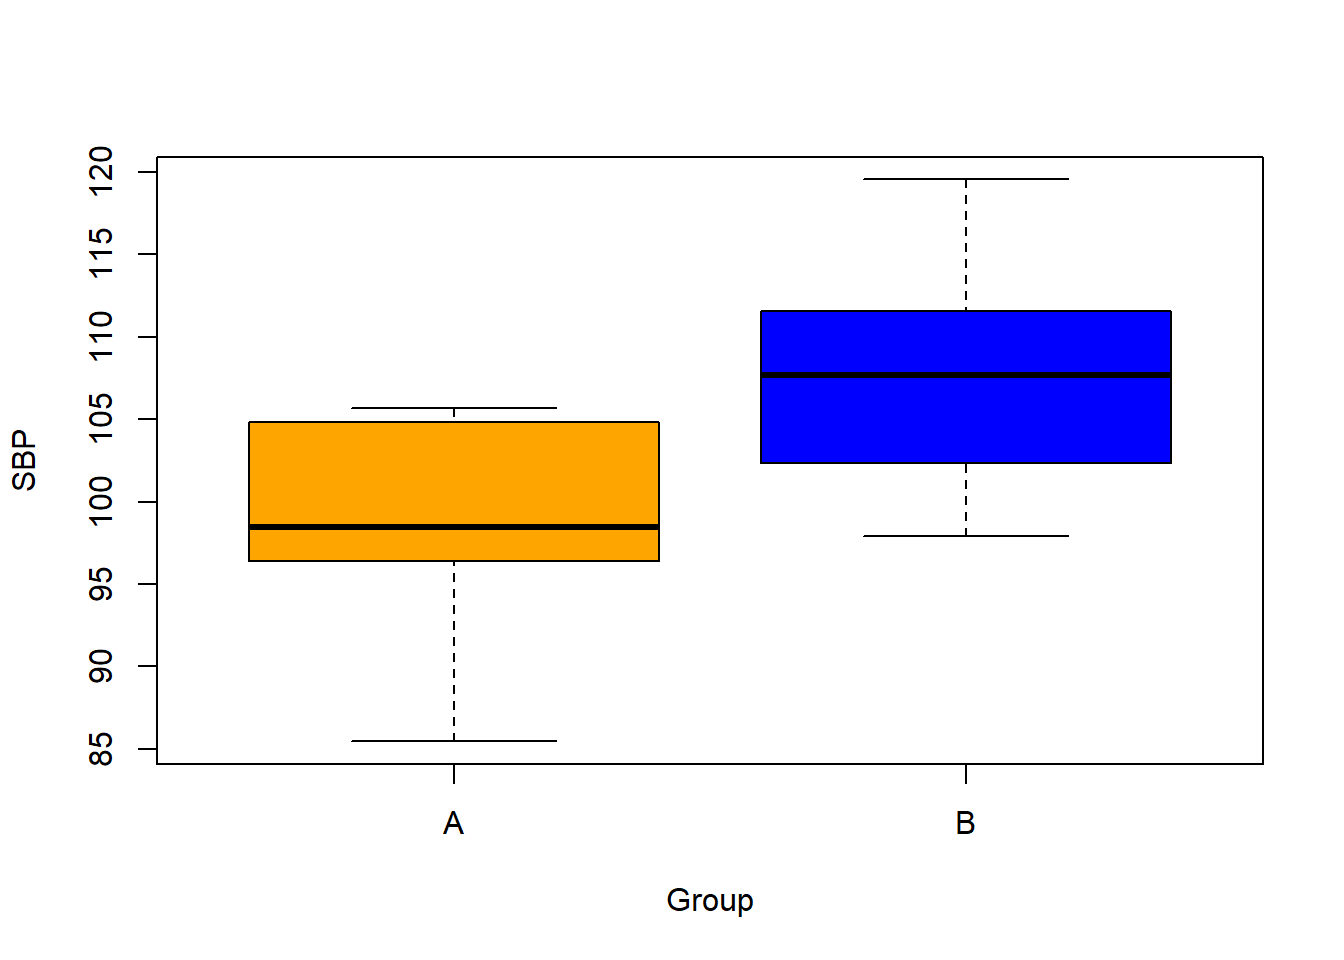
    Two Sample t-test

data:  SBP by Group
t = -2.8201, df = 18, p-value = 0.01134
alternative hypothesis: true difference in means between group A and group B is not equal to 0
95 percent confidence interval:
 -14.574153  -2.129847
sample estimates:
mean in group A mean in group B
         98.938         107.290