Section 19 Hypothesis Testing - Two Samples: Steps
19.1 Model
SBP = Overall Mean + Sampling Variability
\[ \large y_{j} = \mu + \epsilon_{j} \]
SBP = Overall mean + Group effect + Sampling variability
\[ \large y_{ij} = \mu + \beta_{i} + \epsilon_{ij} \]
\(\large y_{ij}\) = j -th observation (replicate) in the i -th treatment
\(\large \mu\) = overall mean effect
\(\large \beta_{i}\) = effect of treatment group i
\(\large \epsilon_{ij} \sim NID(0, \sigma^2)\)
\(\large i\) = treatment index; i: 1, 2
\(\large j\) = observation index within each treatment; j: 1 to n
19.2 Assumptions
Values within each group are independent and normally distributed
Variances of the two groups are equal
19.3 Steps of Hypothesis testing
Identify the parameter of interest
Define \(\large H_O\) and \(\large H_A\)
Define a significance level \(\large \alpha\)
Calculate an estimate of the parameter
Determine an appropriate test statistic, its distribution when \(\large H_O\) is correct, calculate the value of test statistic from the sample
Obtain the probability under the distribution of the test statistic
Compare the observed probability given \(\large \alpha\) and conclude
19.4 Two Samples, Unknown Variance
Inference for a difference in means of two Normal distributions when variances are unknown
19.5 Steps of Hypothesis testing: Details
- Identify the parameter of interest: Population mean \(\large \mu\)
- Define \(\large H_O\) and \(\large H_A\)
\[\large H_O: \mu_1 = \mu_2\]
\[\large H_A: \mu_1 \ne \mu_2\]
- Define \(\large \alpha\)
\[\large \alpha = 0.05\]
- Calculate an estimate of the parameter
Sample Mean: \[ \large \bar{x_1} = \frac{1}{n}\sum\limits_{i=1}^{n} x_{1i} \] \[ \large \bar{x_2} = \frac{1}{n}\sum\limits_{i=1}^{n} x_{2i} \]
Pooled Sample Standard Deviation:
Scenario 1: Variances of TWO samples are equal
\[ \large s = \sqrt{\frac{(n_1-1)s_1^2 + (n_2-1)s_2^2}{n_1+n_2-2}}\]
Scenario 2: Variances of TWO samples are NOT equal
\[ \large s = \sqrt{\frac{s_1^2}{n_1} + \frac{s_2^2}{n_2}}\]
Where: \(\large s_1^2\) and \(\large s_2^2\) are variances from Sample 1 and Sample 2, respectively.
- Determine test statistic, its distribution when \(\large H_O\) is correct, calculate the value of test statistic from the sample.
\[ \large t_{Cal} = \frac{(\bar{x_1}-\bar{x_2}) - (\mu_1 - \mu_2)} {s\sqrt{1/n_1+1/n_2}} \]
\[ \large t_{Cal} = \frac{(\bar{x_1}-\bar{x_2})} {s\sqrt{1/n_1+1/n_2}} \]
- Note - The test statistic is the difference of Observed Difference & Expected Difference - The test statistic represents the ratio of signal to error - The test statistic is centred and scaled
Distribution of the test statistic
Scenario 1: Variances of TWO samples are equal
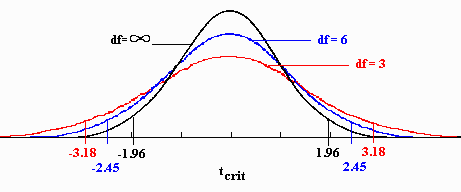
\[\large t \hspace{2mm} distribution \hspace{2mm} with \hspace{2mm} (n_1+n_2-2) \hspace{2mm} df \]
Scenario 2: Variances of TWO samples are NOT equal
The degrees of freedom will be computed.
\[\large degrees \hspace{2mm} of \hspace{2mm} freedom = \frac{(s_1^2 + s_2^2)} {s_1^2/(n_1-1) + s_2^2/(n_2-1)} \]
\[\large t \hspace{2mm} distribution \hspace{2mm} with \hspace{2mm} computed \hspace{2mm} df \]
- Obtain the probability under the distribution of the test statistic (two-tailed probability)
\[\large 2*pt(q = |t_{Cal}|, \space df, \space lower.tail=FALSE)\]
- Compare the observed probability given the \(\large \alpha\) and conclude
Find the probability that \(\large t\) is less than or equal to \(\large |t_{Cal}|\) from \(\large t\) distribution with \(\large (n_1+n_2-2)\) degrees of freedom for the Scenario 1. Use integer values of degrees of freedom for the Scenario 2.