Section 33 Estimates
33.1 Estimates: Effects
\[ \large fm \leftarrow lm(SBP \sim Group, \space data=BP) \]
\[ \large summary(fm) \]
Call:
lm(formula = SBP ~ Group, data = BP)

Residuals:
    Min      1Q  Median      3Q     Max
-19.093  -5.101   0.146   5.960  13.772

Coefficients:
            Estimate Std. Error t value Pr(>|t|)
(Intercept)   98.938      2.601  38.041  < 2e-16 ***
GroupB         8.352      3.678   2.271   0.0292 *
GroupC         4.730      3.678   1.286   0.2067
GroupD        16.855      3.678   4.582 5.34e-05 ***
---
Signif. codes:  0 '***' 0.001 '**' 0.01 '*' 0.05 '.' 0.1 ' ' 1

Residual standard error: 8.225 on 36 degrees of freedom
Multiple R-squared:  0.3846,    Adjusted R-squared:  0.3333
F-statistic: 7.498 on 3 and 36 DF, p-value: 0.0005059| Estimate | Std. Error | t value | Pr(>|t|) | |
|---|---|---|---|---|
| (Intercept) | 98.938 | 2.6008 | 38.0407 | 0.0000 |
| GroupB | 8.352 | 3.6782 | 2.2707 | 0.0292 |
| GroupC | 4.730 | 3.6782 | 1.2860 | 0.2067 |
| GroupD | 16.855 | 3.6782 | 4.5825 | 0.0001 |
33.2 Estimates: Means
\[ \large fm1 \leftarrow lm(SBP \sim -1 + Group, \space data=BP) \]
\[ \large summary(fm1) \]
Call:
lm(formula = SBP ~ -1 + Group, data = BP)

Residuals:
    Min      1Q  Median      3Q     Max
-19.093  -5.101   0.146   5.960  13.772

Coefficients:
       Estimate Std. Error t value Pr(>|t|)
GroupA   98.938      2.601   38.04   <2e-16 ***
GroupB  107.290      2.601   41.25   <2e-16 ***
GroupC  103.668      2.601   39.86   <2e-16 ***
GroupD  115.793      2.601   44.52   <2e-16 ***
---
Signif. codes:  0 '***' 0.001 '**' 0.01 '*' 0.05 '.' 0.1 ' ' 1

Residual standard error: 8.225 on 36 degrees of freedom
Multiple R-squared:  0.9947,    Adjusted R-squared:  0.9941
F-statistic: 1680 on 4 and 36 DF, p-value: < 2.2e-16| Estimate | Std. Error | t value | Pr(>|t|) | |
|---|---|---|---|---|
| GroupA | 98.938 | 2.6008 | 38.0407 | 0 |
| GroupB | 107.290 | 2.6008 | 41.2520 | 0 |
| GroupC | 103.668 | 2.6008 | 39.8593 | 0 |
| GroupD | 115.793 | 2.6008 | 44.5213 | 0 |
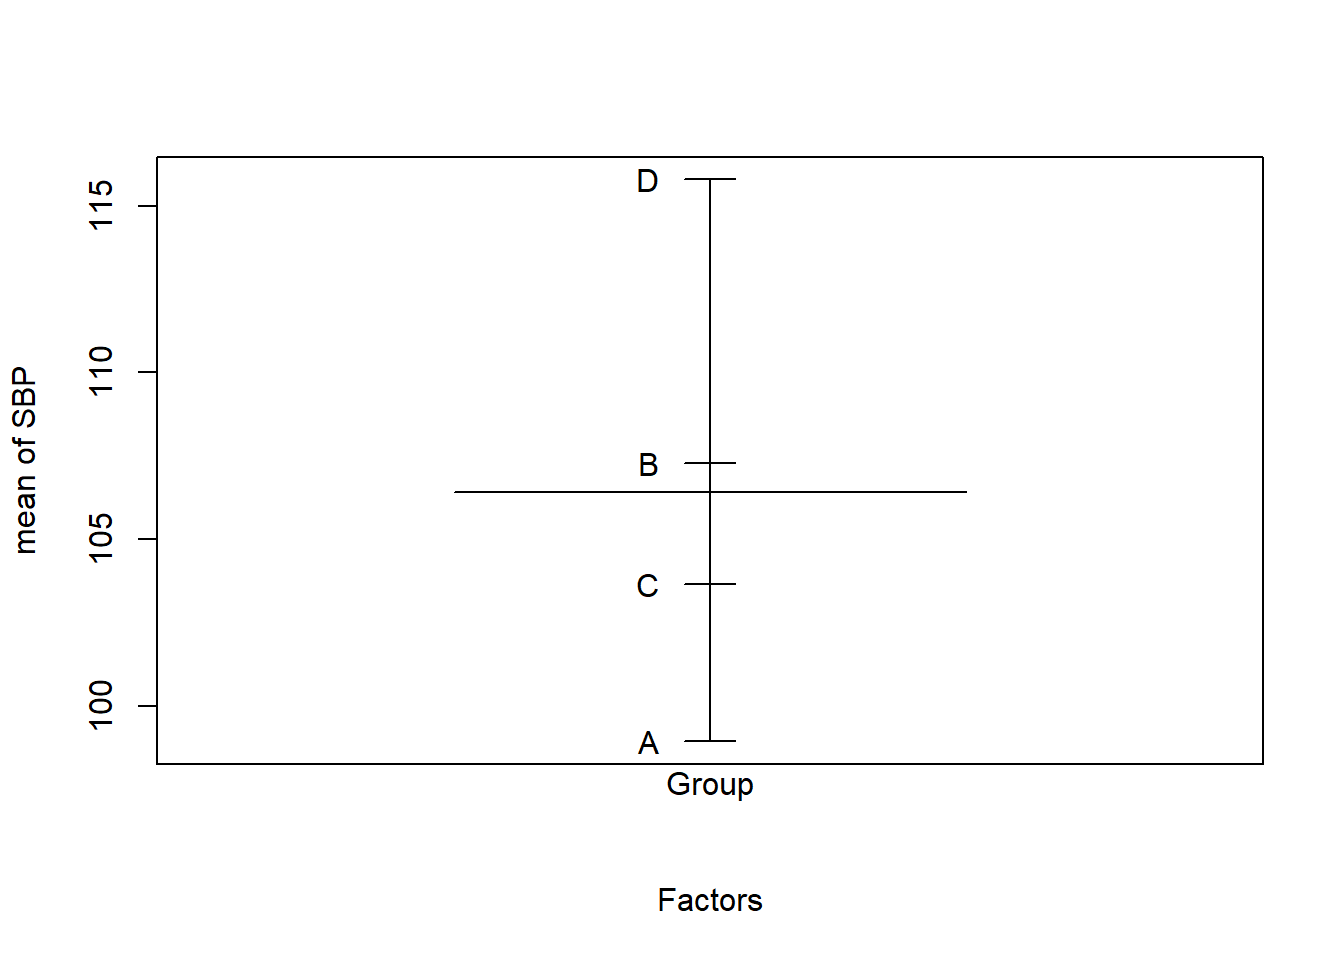
plot.design(SBP ~ Group, data=BP)