Section 20 t.test Outputs
20.1 Subset and summarise data
Subset the BP data as a new data.frame
pBPwith only two Groups A & BObtain the mean and sd of
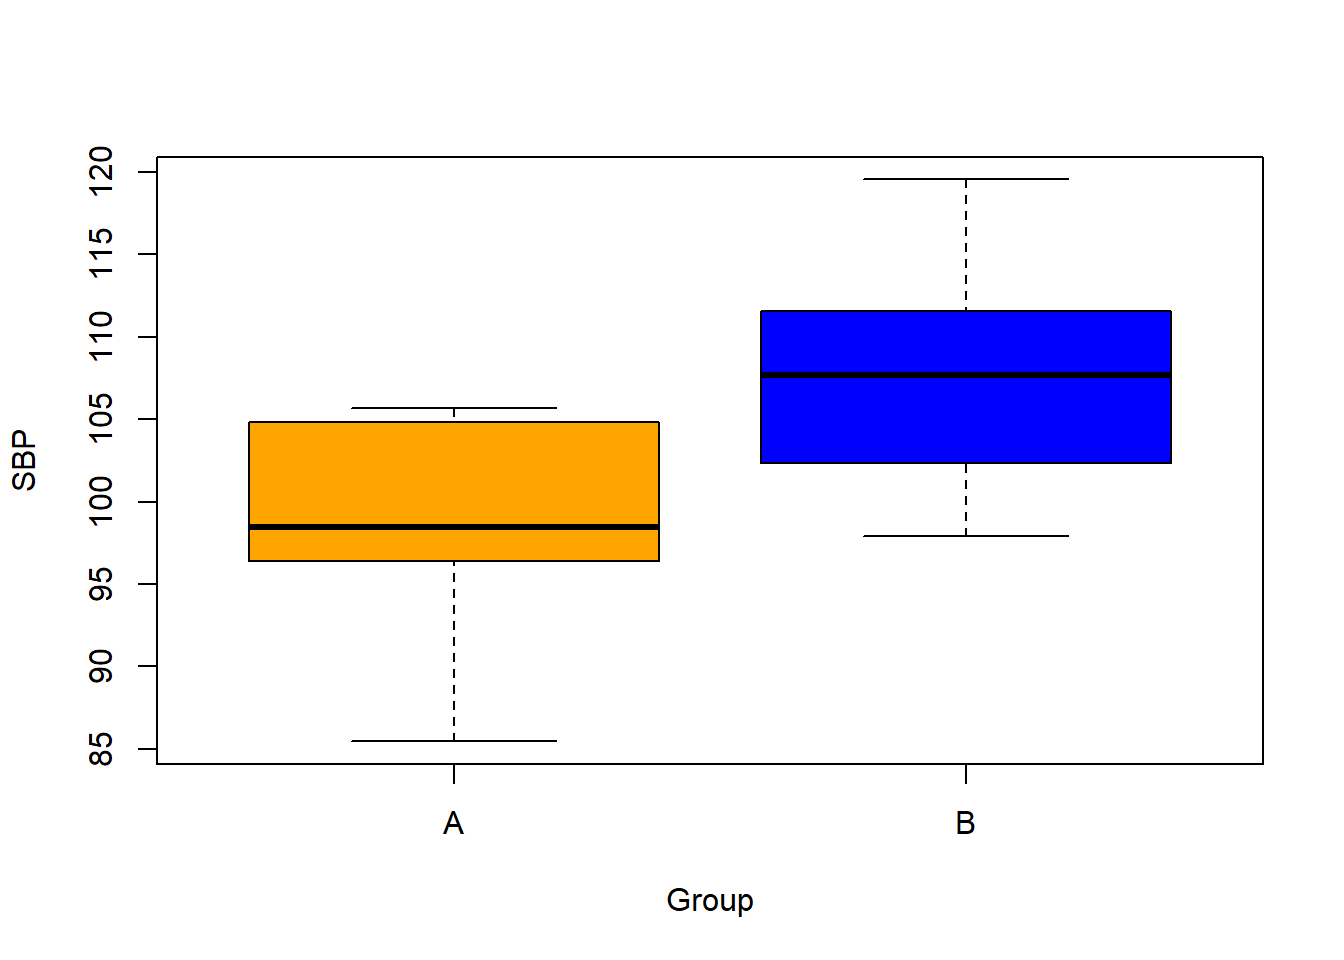
SBPfor Groups A & BCreate appropriate plots to compare the data on
SBPbetween Groups A & B
20.2 t.test
Perform the
t.testto compare if the mean difference for SBP between Group A and B is significantly different.Examine the R object of the
t.testoutputs.Write your own function to conduct the
t.test.
20.4 R codes
# Read the data
BP <- read.csv('data/BP.csv')


# Explore the data structure
# str(BP)


# Subset the data
index <- which(BP$Group=='A' | BP$Group=='B')
pBP <- BP[index,]
pBP$Group <- as.factor(as.character(pBP$Group))


# Summary statistics of the data
# with(data=pBP, tapply(X = SBP, INDEX = Group, FUN = mean, na.rm=TRUE))
# with(data=pBP, tapply(X = SBP, INDEX = Group, FUN = sd, na.rm=TRUE))
# plot(SBP ~ Group, data = pBP, col=c('orange','blue'))


# Perform the t.test
t_BP <- t.test(SBP ~ Group,
               alternative = 'two.sided',
               mu = 0,
               var.equal = TRUE,
               conf.level = 0.95,
               data = pBP)
20.5 R Outputs
    Two Sample t-test

data:  SBP by Group
t = -2.8201, df = 18, p-value = 0.01134
alternative hypothesis: true difference in means between group A and group B is not equal to 0
95 percent confidence interval:
 -14.574153  -2.129847
sample estimates:
mean in group A mean in group B
         98.938         107.290
20.6 Exercise: Write a simple t.test fn
Write a R function to calculate one-sample z-statistic which accepts the data vector, hypothesised mean and alpha (with default as 0.05), and returns the outputs of the one-sample z-test.
Test the function using a random vector of 30 observations sampled from a normal distribution with mean of 20 and standard deviation of 2.