Section 36 Estimates using library(lsmeans)
\[ \large fm \leftarrow lm(SBP \sim Group, \space data=BP) \]
36.2 Estimated Means & CI
Confidence level used: 0.95
| Group | lsmean | SE | df | lower.CL | upper.CL | |
|---|---|---|---|---|---|---|
| 1 | A | 98.938 | 2.6008 | 36 | 93.6632 | 104.2128 |
| 2 | B | 107.290 | 2.6008 | 36 | 102.0152 | 112.5648 |
| 3 | C | 103.668 | 2.6008 | 36 | 98.3932 | 108.9428 |
| 4 | D | 115.793 | 2.6008 | 36 | 110.5182 | 121.0678 |
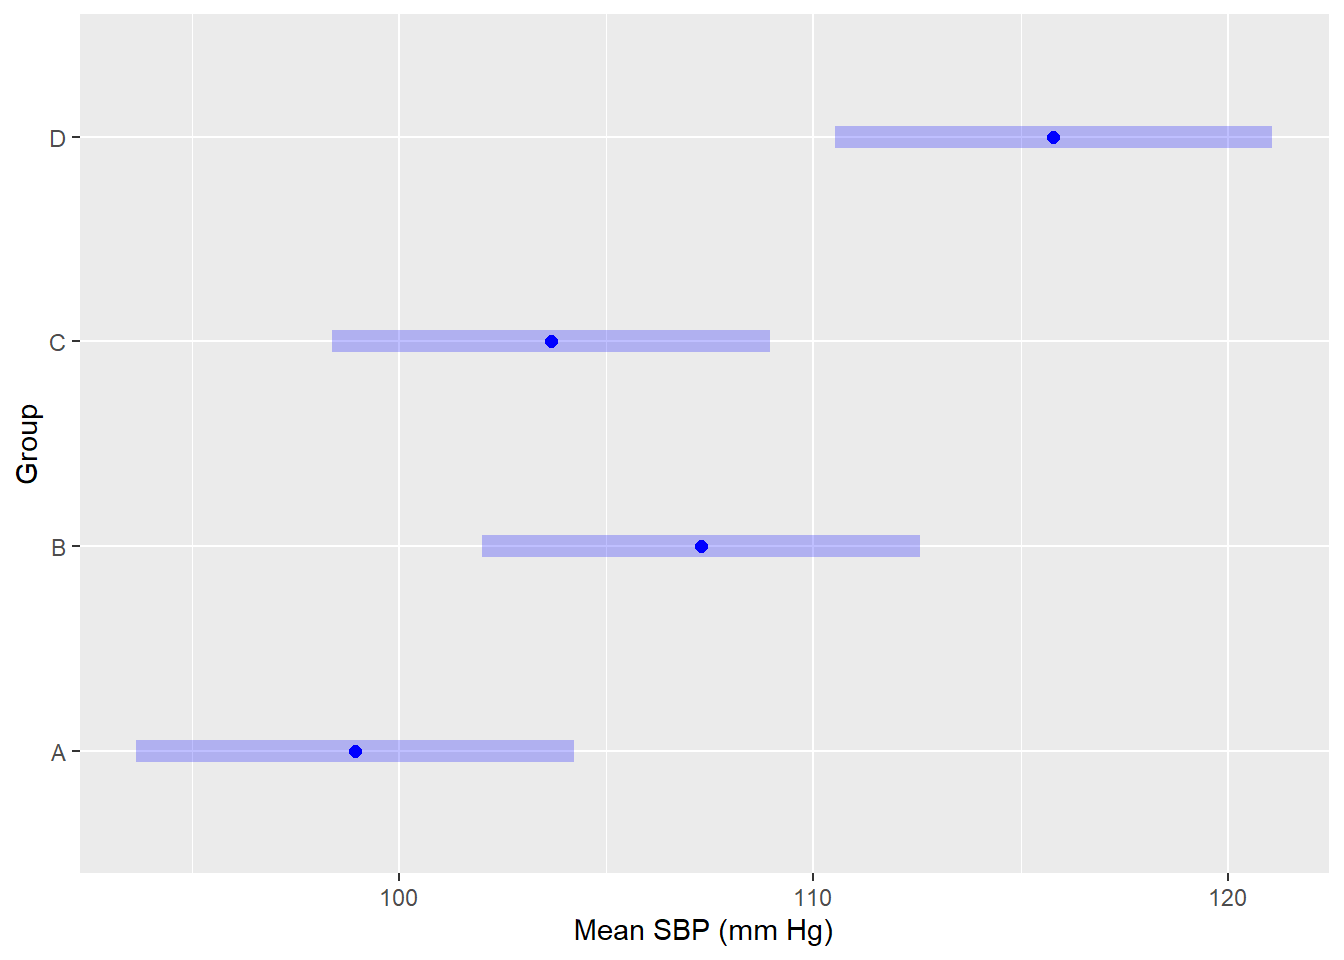
plot(gr.means, intervals=TRUE, level=0.95,
     horizontal = TRUE, col='blue', cex=2,
     xlab='Mean SBP (mm Hg)', ylab='Group')