Rcmdr
data(iris)
data(BP)
t.test
lm
library(lsmeans)
aov
library(multcomp)
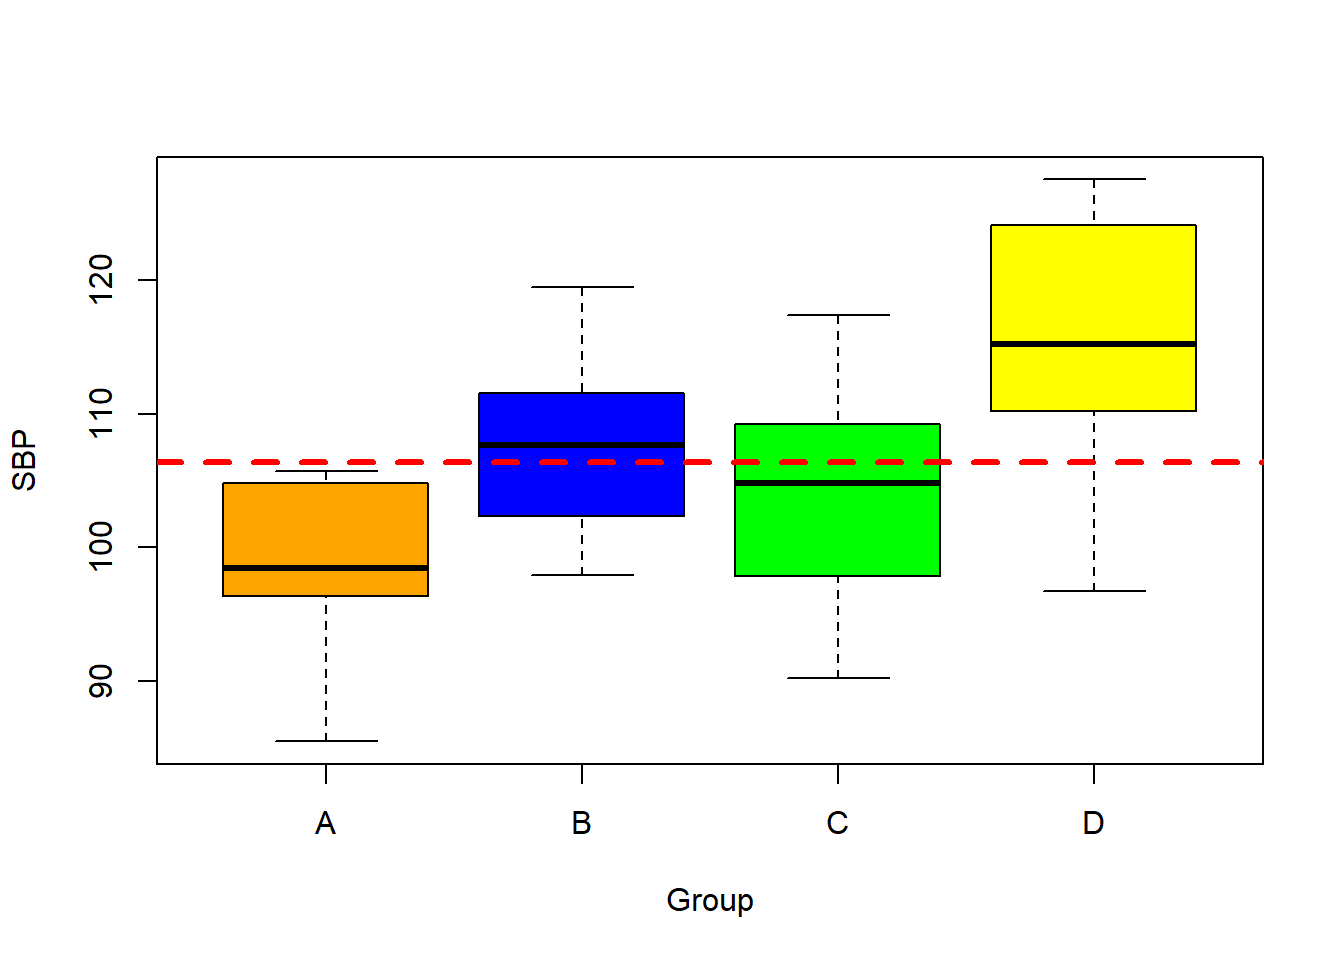
Figure: Box plots showing the SBP data for all FOUR treatment groups.