Section 33 ggplot2 legend
33.1 Add Legends to plots
33.1.1 Function
legend
?legend
33.2 Default legends
g <- ggplot(data=iris,
            mapping=aes(x=Species, y=Sepal.Length, fill=Species))
g <- g + geom_boxplot()
g <- g + labs(title='Boxplot of iris data',
              subtitle = 'Based on iris data',
              x='Species',
              y='Sepal Length (cm)')
g <- g + theme_bw()
g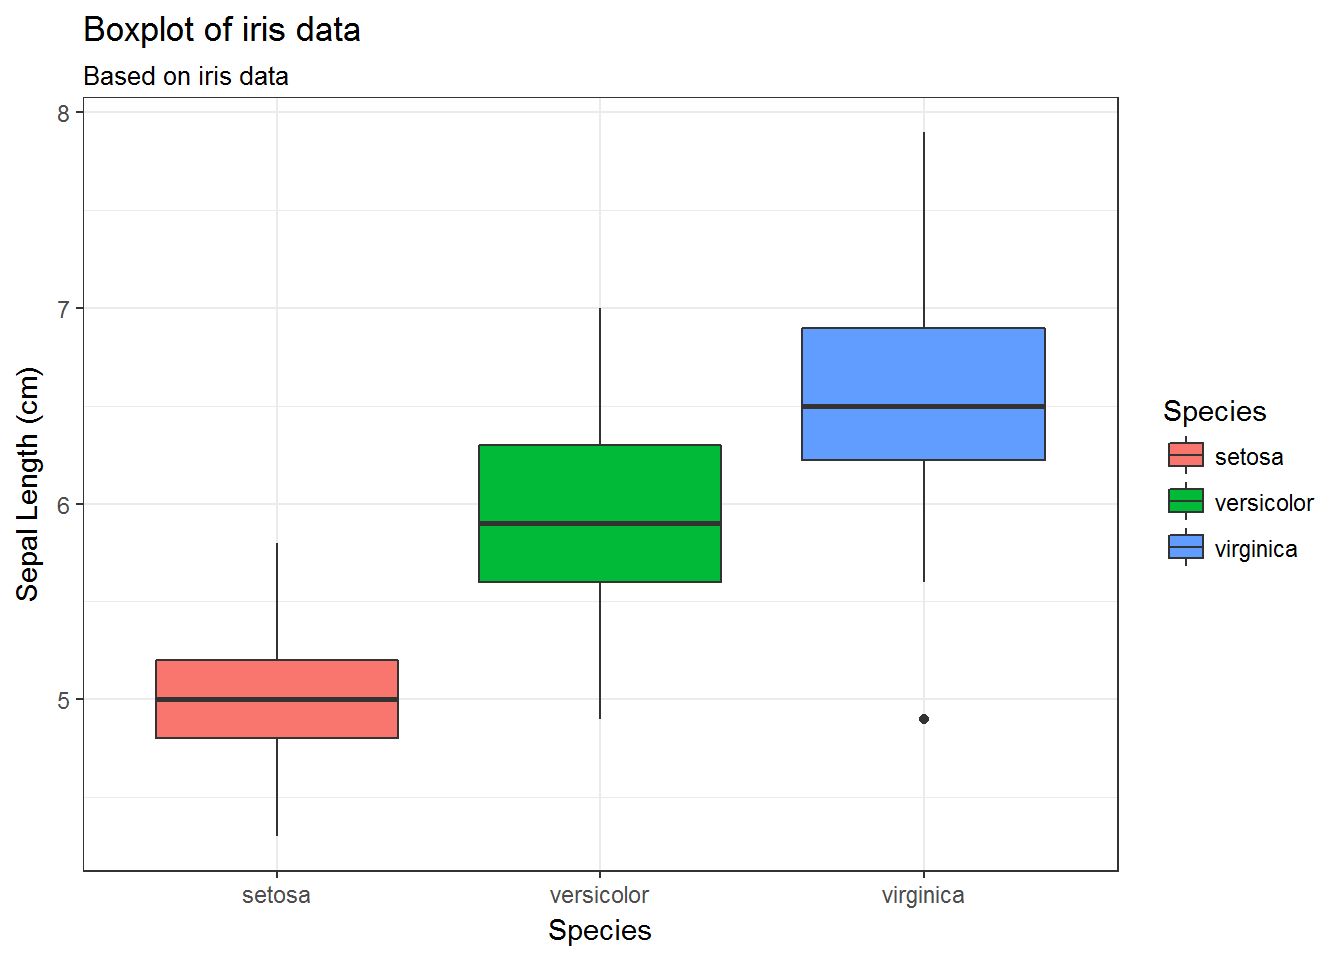
33.3 Remove legends
# Option 1: Remove legend for a particular aesthetic (fill)
g + guides(fill=FALSE)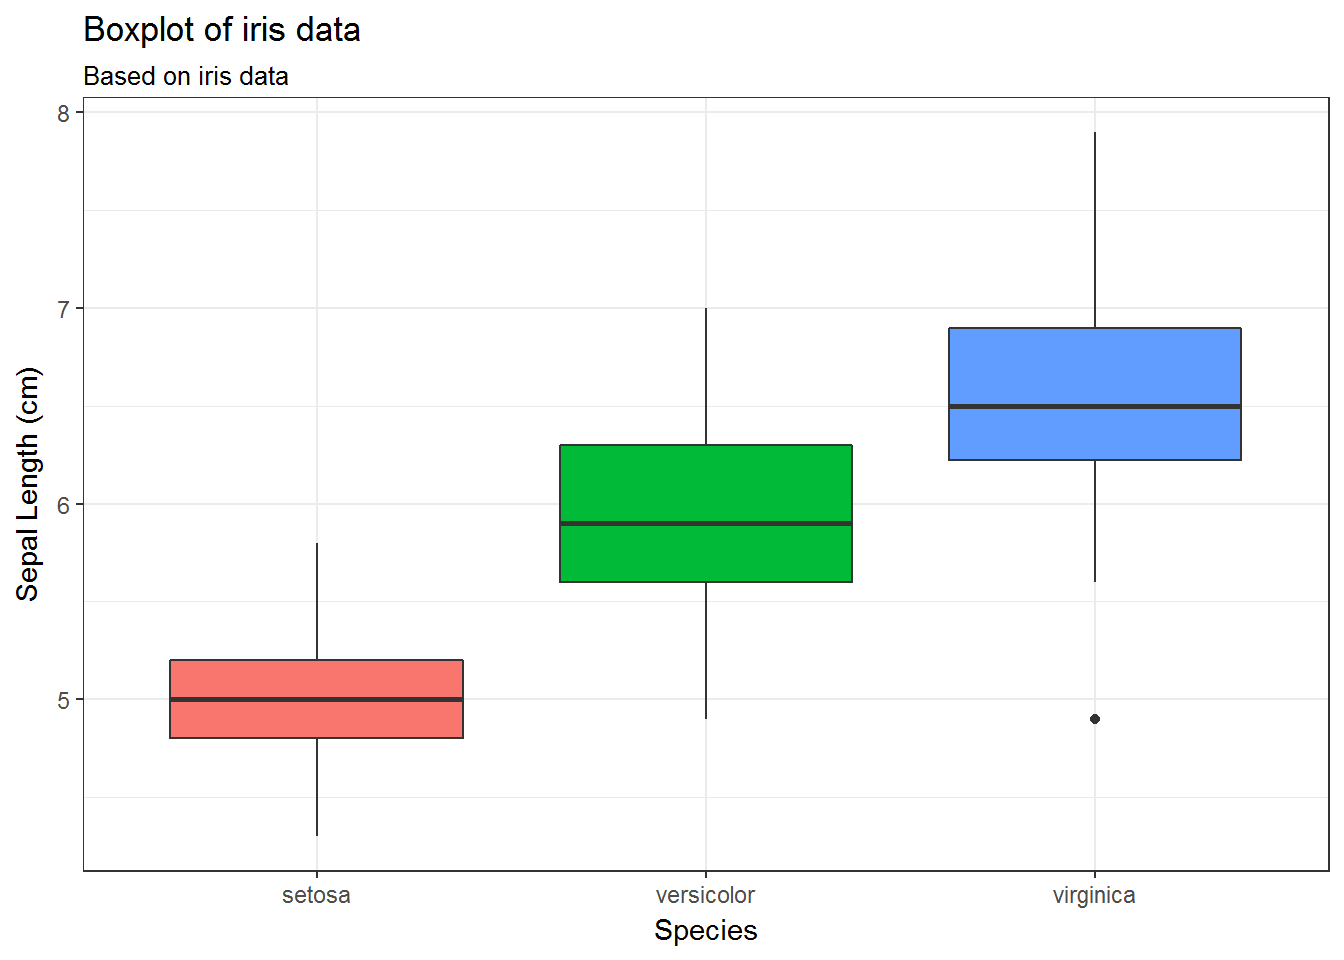
# Option 2: Remove all legends
g + theme(legend.position='none')
# Option 3: Remove legend specifying the scale
g + scale_fill_discrete(guide=FALSE)
33.4 Change legend position
g + theme(legend.position='bottom')
g + theme(legend.position='top')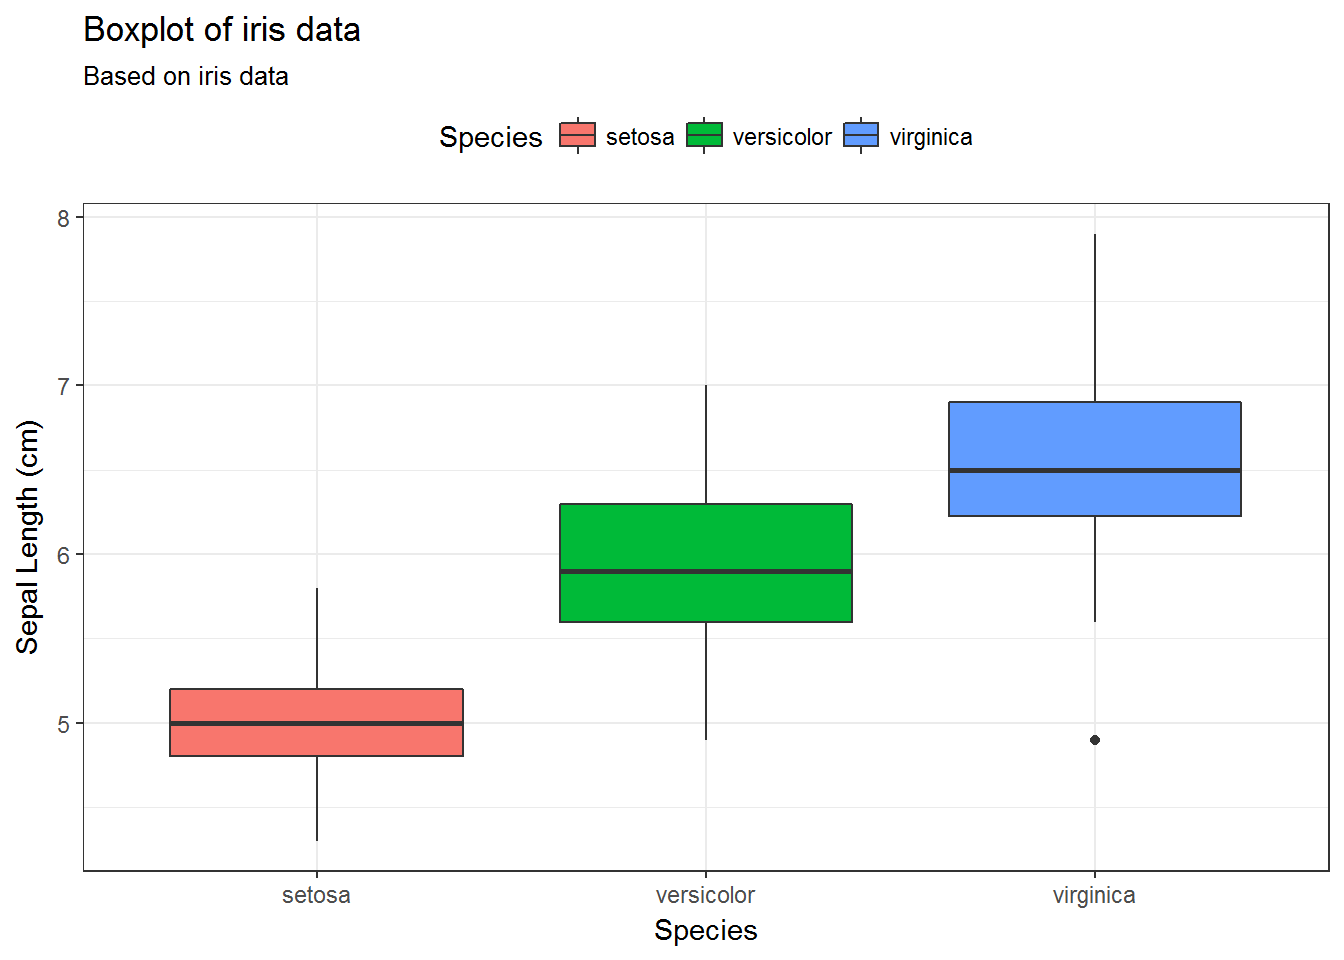
g + theme(legend.position='left')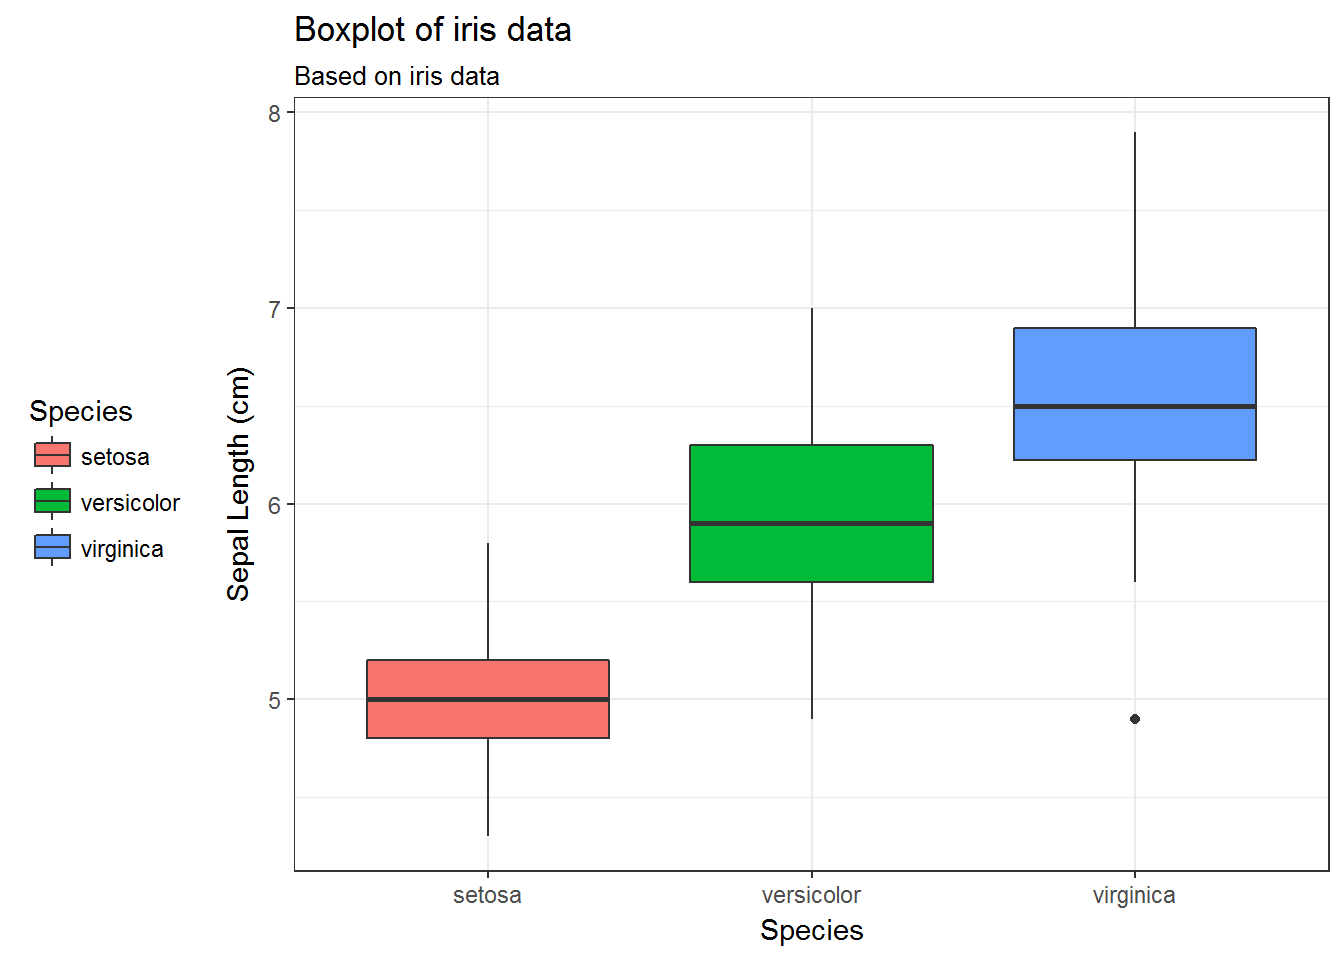
g + theme(legend.position='right')