Section 17 One Numeric: geom_histogram
The function geom_histogram maps the data to histogram.
17.1 Example 1:
data(iris)
?geom_histogram
library(ggplot2)

# geom_histogram
g <- ggplot(data=iris, mapping=aes(Sepal.Length))
g <- g + geom_histogram()
g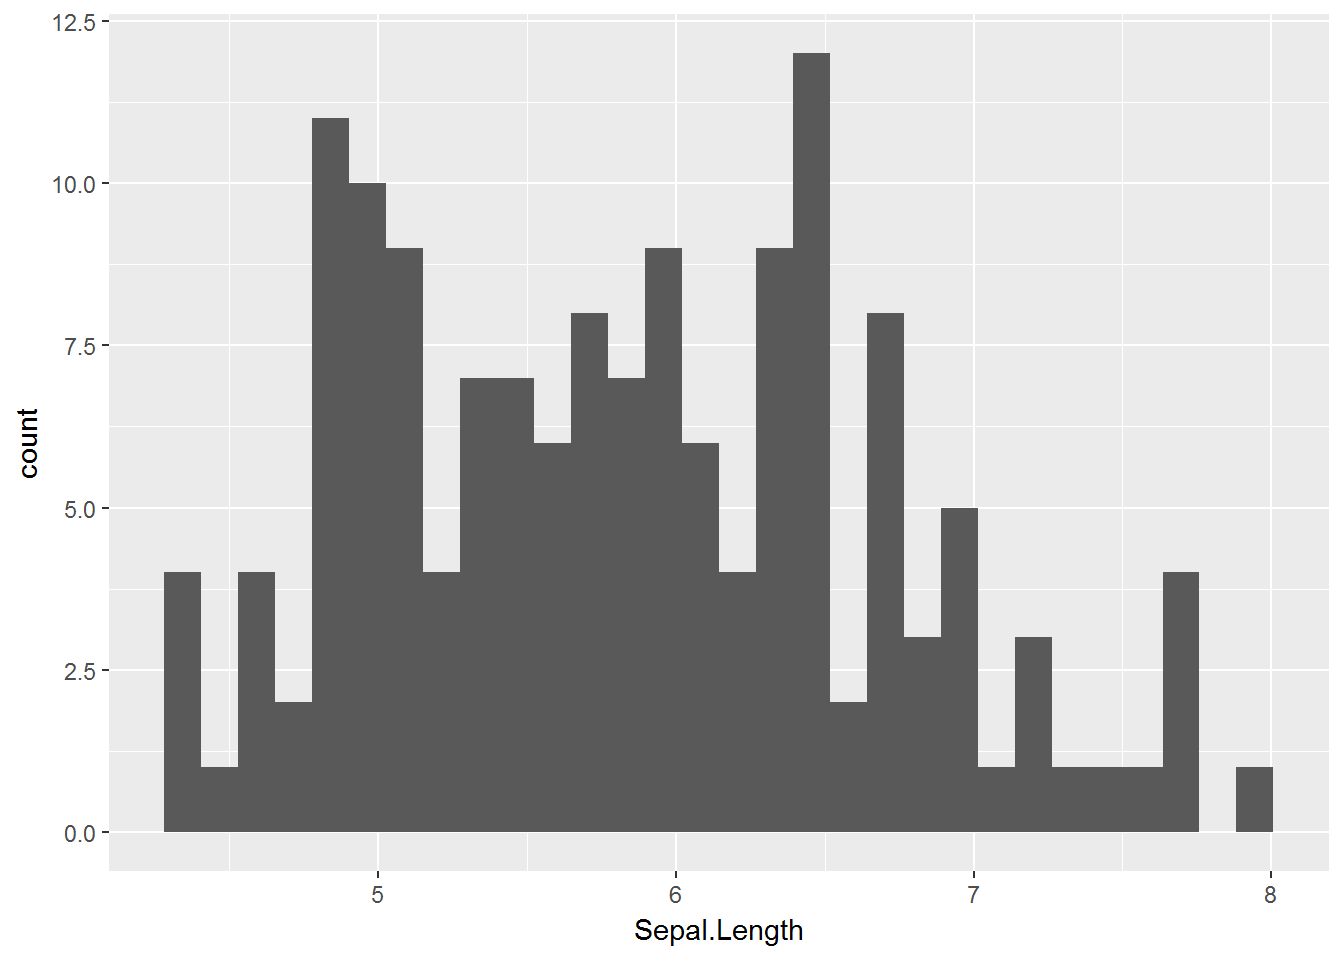
# bins
g <- ggplot(data=iris, mapping=aes(Sepal.Length))
g <- g + geom_histogram(bins=40)
g
# binwidth
g <- ggplot(data=iris, mapping=aes(Sepal.Length))
g <- g + geom_histogram(binwidth=0.10)
g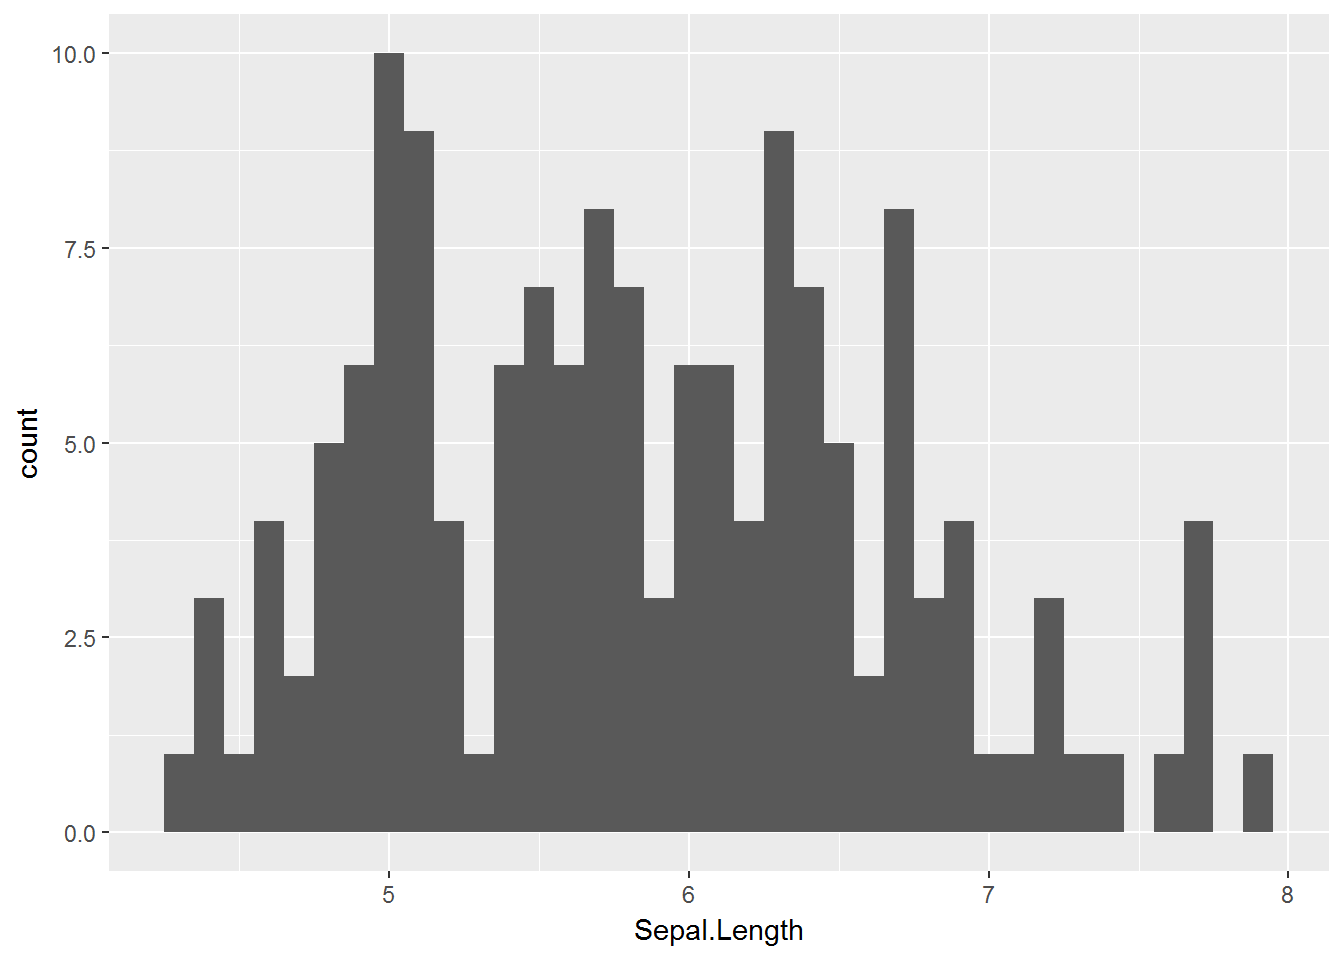
# fill & colour
g <- ggplot(data=iris, mapping=aes(Sepal.Length))
g <- g + geom_histogram(binwidth=0.10, fill='lightblue', colour='purple')
g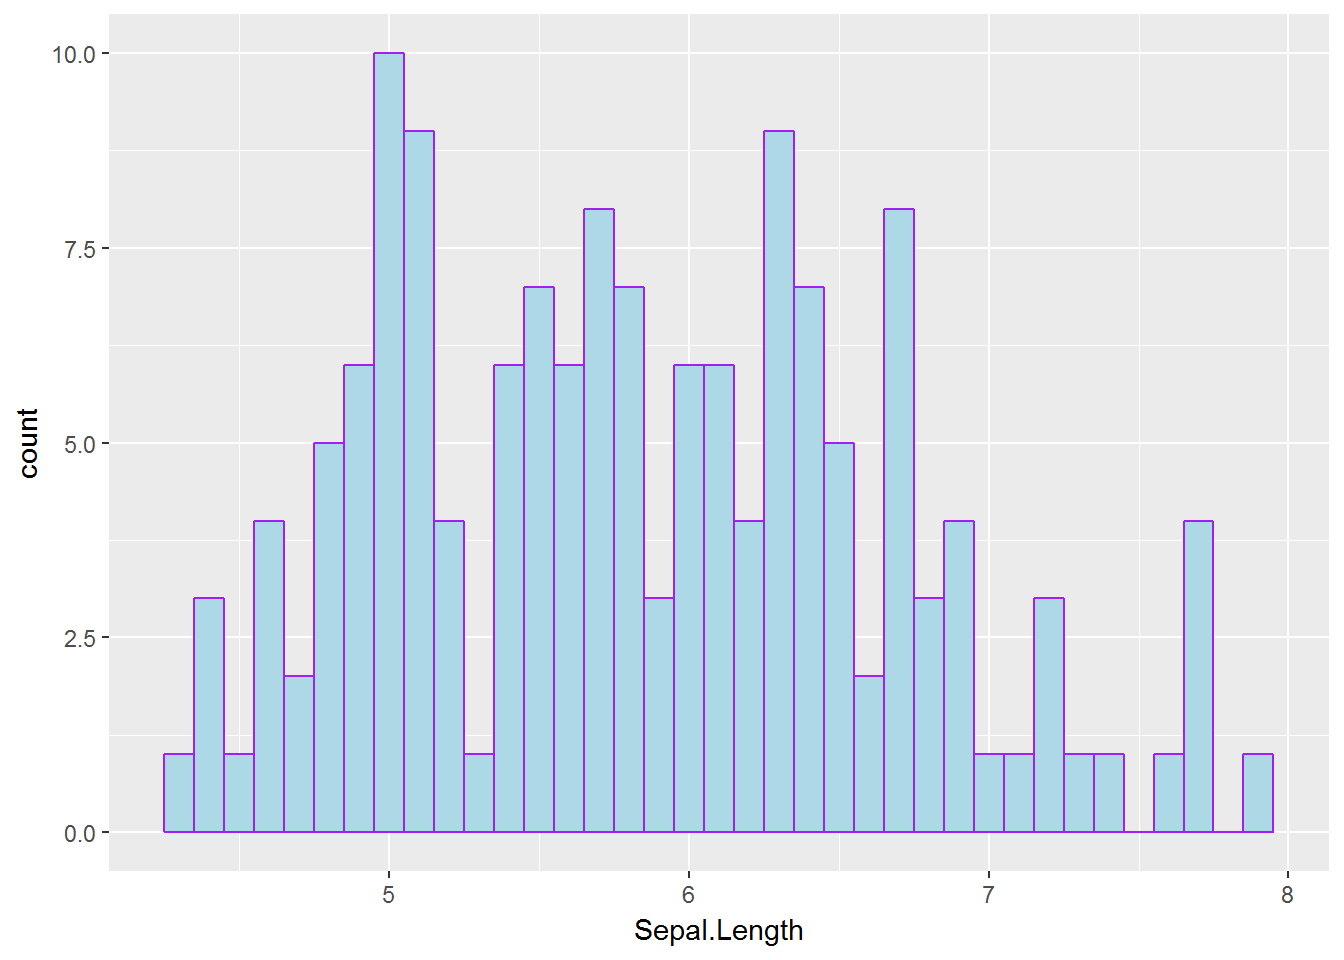
# labs
g <- ggplot(data=iris, mapping=aes(Sepal.Length))
g <- g + geom_histogram(binwidth=0.10, fill='lightblue', colour='purple')
g <- g + labs(title='Histogram of Sepal Length',
              subtitle='Based on Iris data',
              x='Sepal Length (cm)',
              y='Count')
g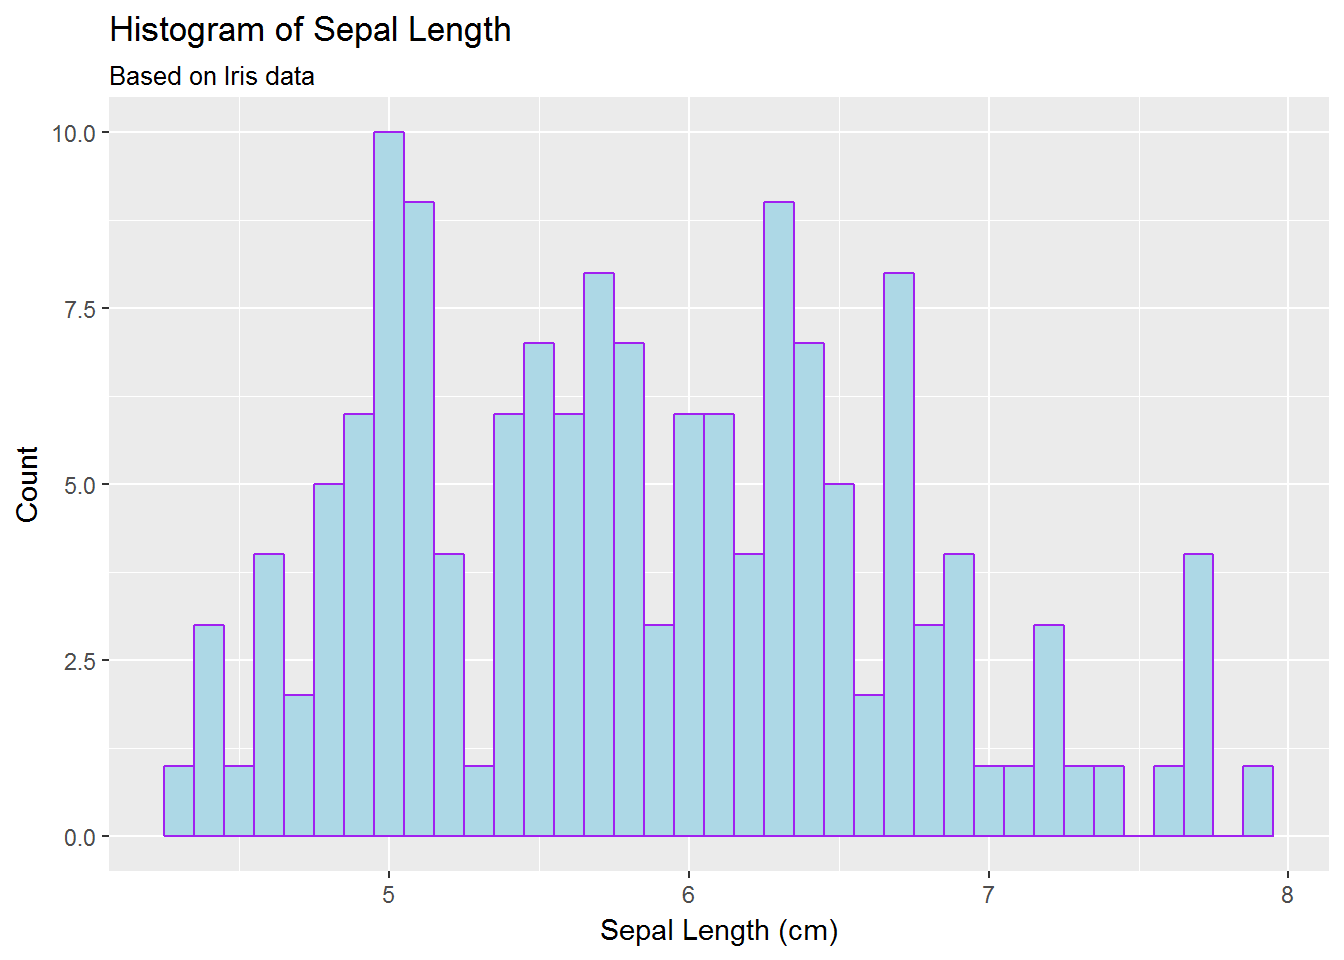
# density
g <- ggplot(data=iris, mapping=aes(Sepal.Length))
g <- g + geom_histogram(mapping=aes(y=..density..),
                        binwidth=0.10, fill='lightblue', colour='purple')
g <- g + labs(title='Histogram of Sepal Length',
              subtitle='Based on Iris data',
              x='Sepal Length (cm)',
              y='Density')
g
# vline
g <- ggplot(data=iris, mapping=aes(Sepal.Length))
g <- g + geom_histogram(mapping=aes(y=..density..),
                        binwidth=0.10, fill='lightblue', colour='purple')
g <- g + geom_vline(aes(xintercept=mean(Sepal.Length, na.rm=TRUE)),
                    colour='red', linetype='dashed', size=1.5)
g <- g + labs(title='Histogram of Sepal Length',
              subtitle='Based on Iris data',
              x='Sepal Length (cm)',
              y='Density')
g
# theme_bw()

g <- ggplot(data=iris, mapping=aes(Sepal.Length))
g <- g + geom_histogram(mapping=aes(y=..density..),
                        binwidth=0.10, fill='lightblue', colour='purple')
g <- g + geom_vline(aes(xintercept=mean(Sepal.Length, na.rm=TRUE)),
                    colour='red', linetype='dashed', size=1.5)
g <- g + labs(title='Histogram of Sepal Length',
              subtitle='Based on Iris data',
              x='Sepal Length (cm)',
              y='Density')

g + theme_bw()
17.2 Example 2:
data(warpbreaks)
Draw a histogram of the variable
breaksDiscuss the histogram
Transform the data using log-transformation and redraw the histogram