Section 26 Multiple Plot Layout: facet_wrap
The function facet_wrap wraps a 1d sequence of panels into 2d. This is generally a better use of screen space than facet_grid because most displays are roughly rectangular.
26.1 Function
facet_wrap(facets, nrow = NULL, ncol = NULL, scales = "fixed", shrink = TRUE, labeller = "label_value", as.table = TRUE, switch = NULL, drop = TRUE, dir = "h", strip.position = "top")
26.2 Columns
ggplot(mpg, aes(displ, hwy)) +
       geom_point() +
       facet_wrap(~class)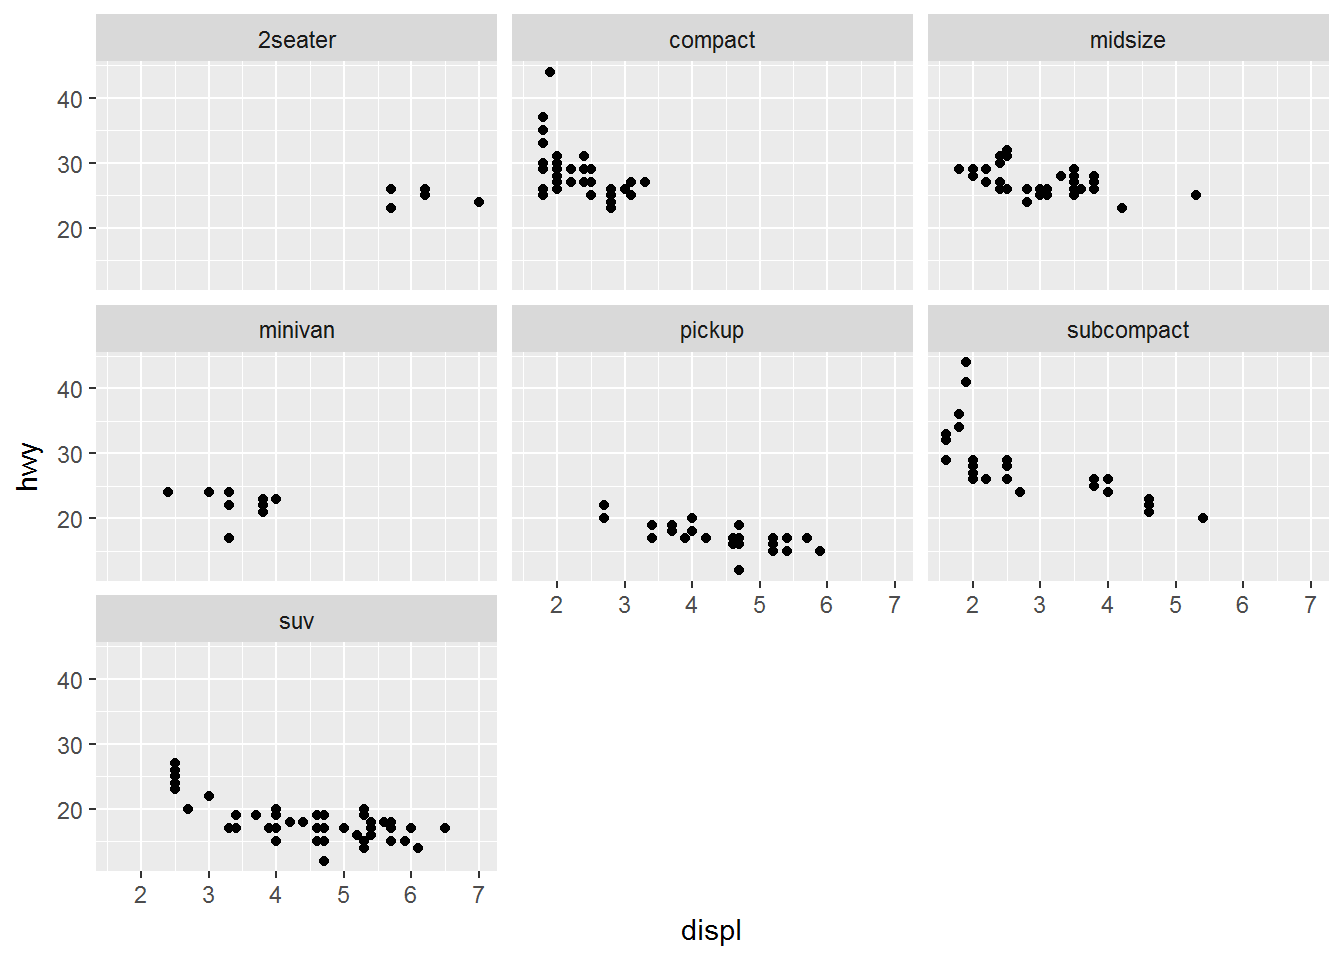
26.3 nrow & ncol options
# Control the number of rows and columns with nrow and ncol
ggplot(mpg, aes(displ, hwy)) +
       geom_point() +
       facet_wrap(~class, nrow = 4)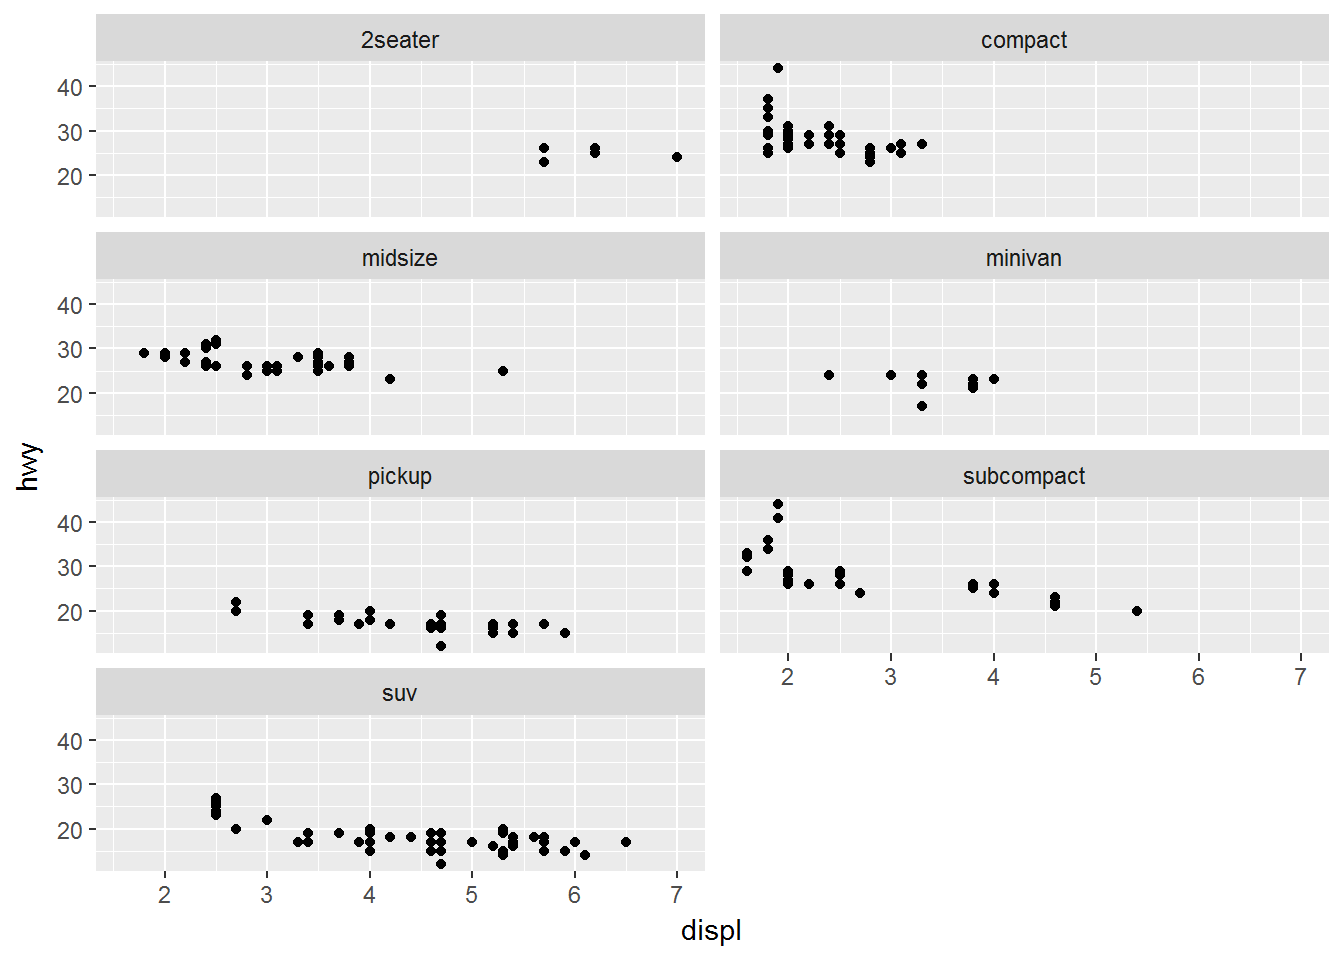
26.4 Multiple faceting variables
# You can facet by multiple variables
ggplot(mpg, aes(displ, hwy)) +
       geom_point() +
       facet_wrap(~ cyl + drv)
26.5 Use character vector
ggplot(mpg, aes(displ, hwy)) +
       geom_point() +
       facet_wrap(c("cyl", "drv"))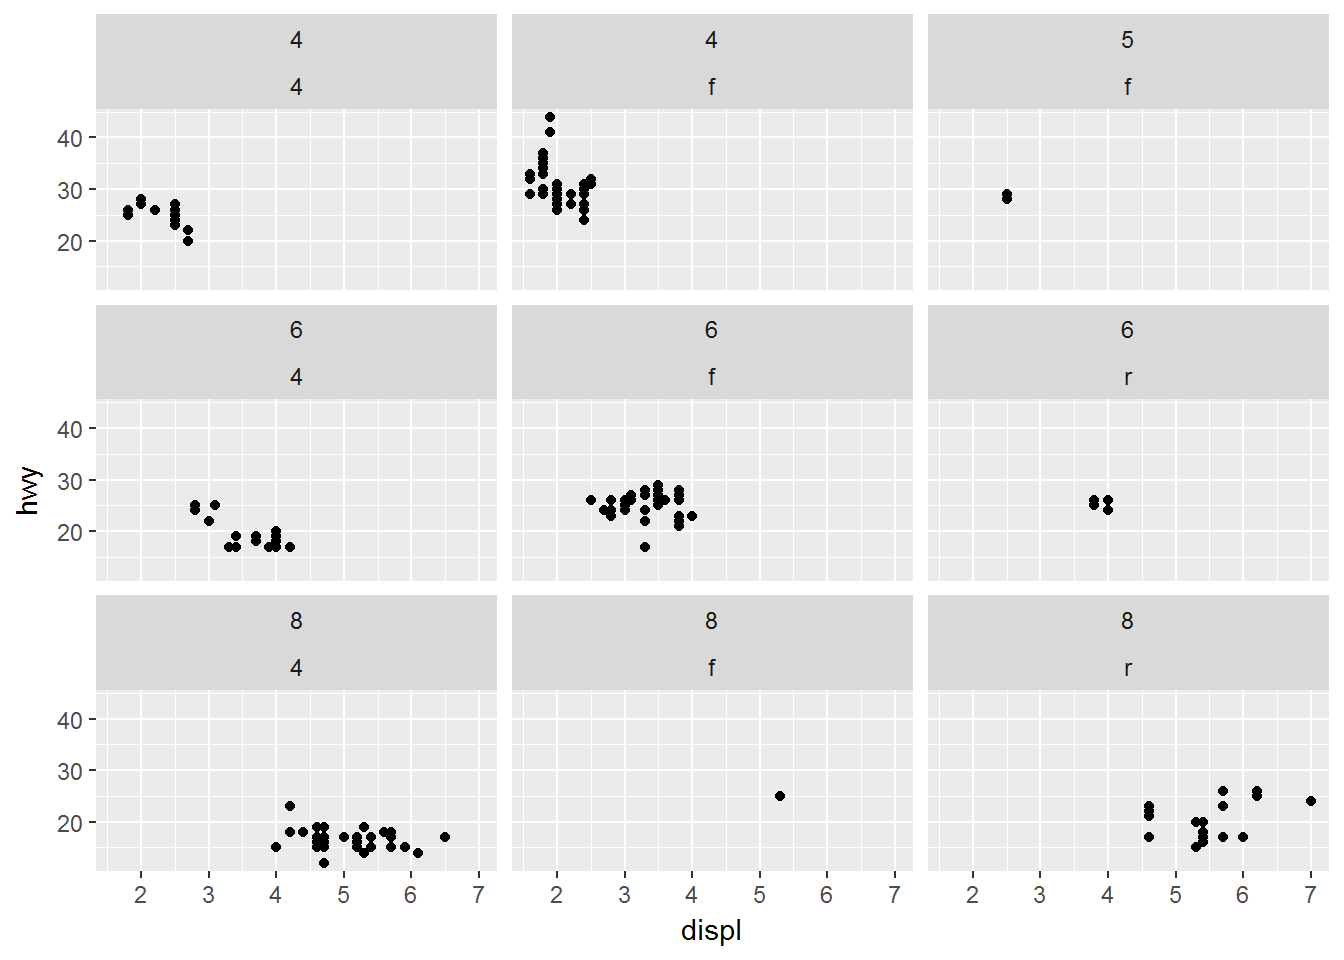
Note: Use the labeller option to control how labels are printed.
26.6 Exercise
Compare wt against mpg for different levels of am and gear from the mtcars data.