Section 22 One Factor
22.1 Bar plot
The function geom_bar produces a bar plot with options for vertical or horizontal bars.
g <- ggplot(data = mtcars, aes(x = factor(cyl)))
g <- g + geom_bar()
g
g <- ggplot(data = mtcars, aes(x = factor(cyl)))
g <- g + geom_bar(fill = c("red", "lightblue", "green"))
g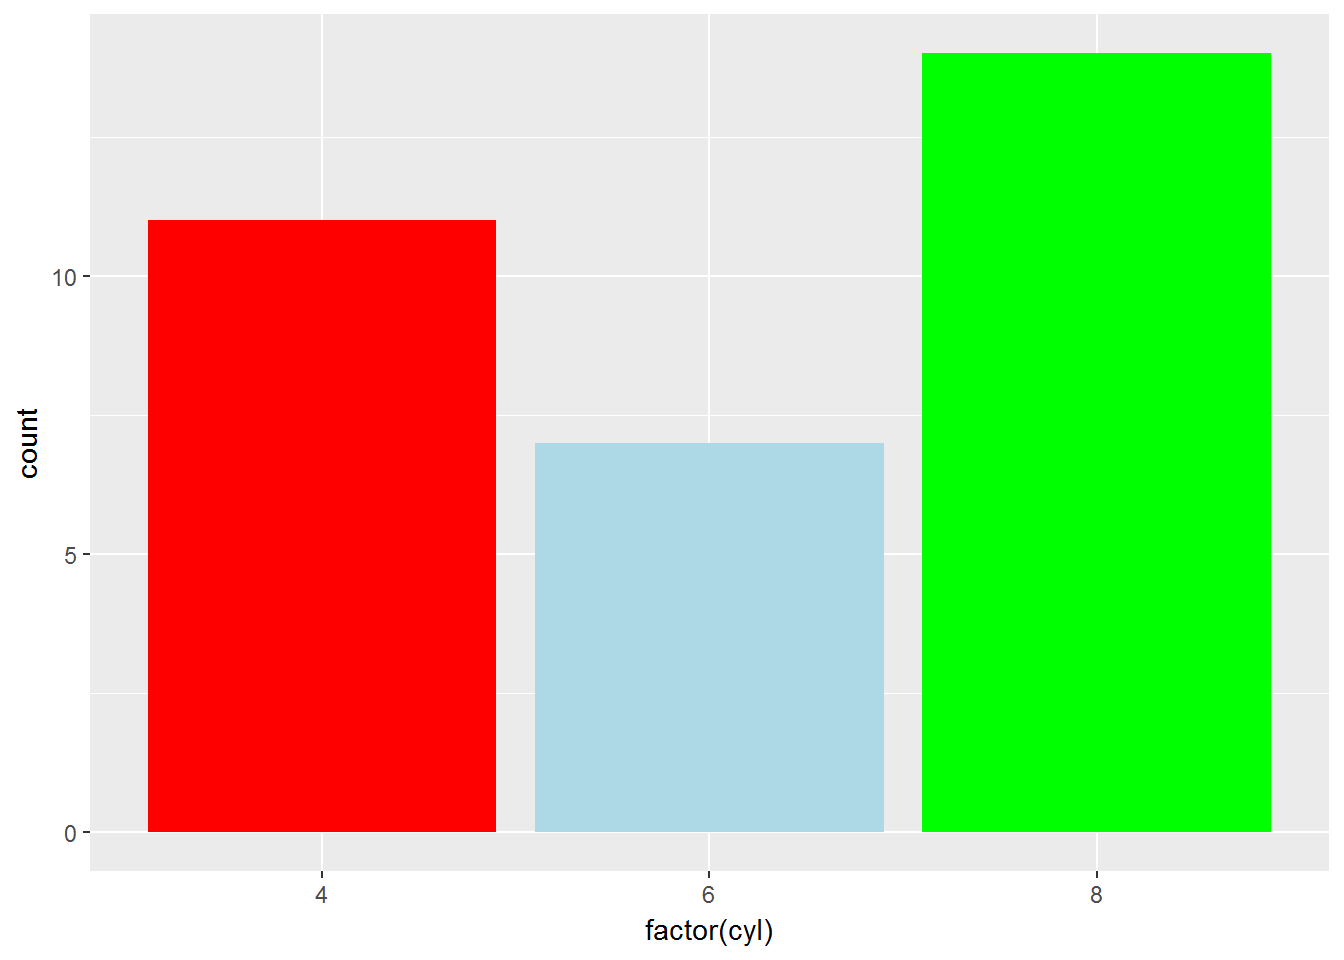
g <- ggplot(data = mtcars, aes(x = factor(cyl)))
g <- g + geom_bar(fill = c("red", "lightblue", "green"))
g <- g + labs(title = "Barplot of number of cylinders", subtitle = "Based on mtcars data",
    x = "Number of cylinders", y = "Count")
g + theme_bw()
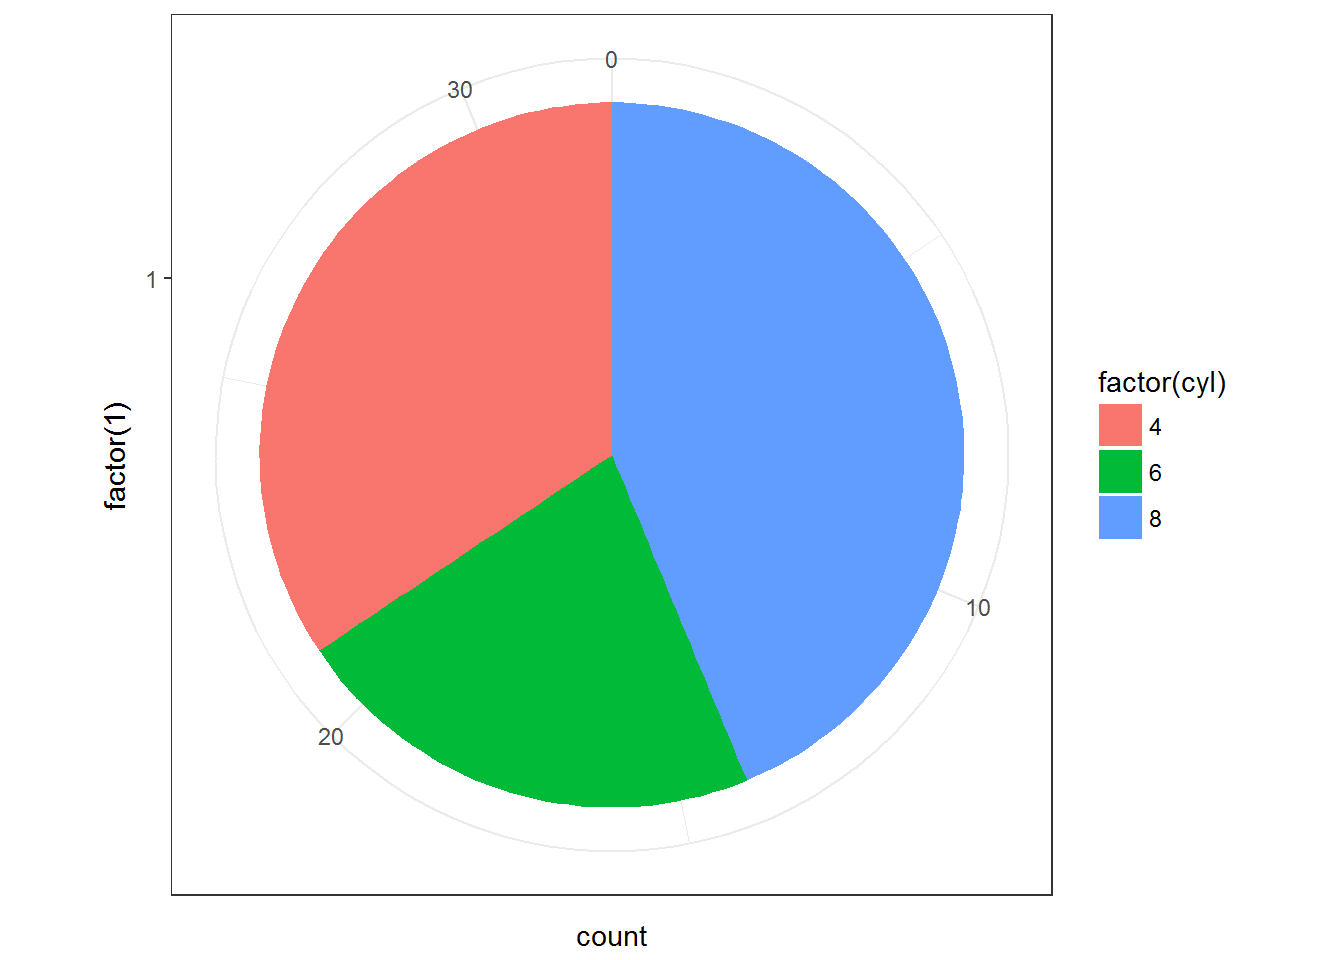
22.2 Pie chart
The function geom_bar along with coord_polar creates a pie chart
# geom_bar
g <- ggplot(data=mtcars, aes(x=factor(1), fill=factor(cyl)))
g <- g + geom_bar(width=1)
g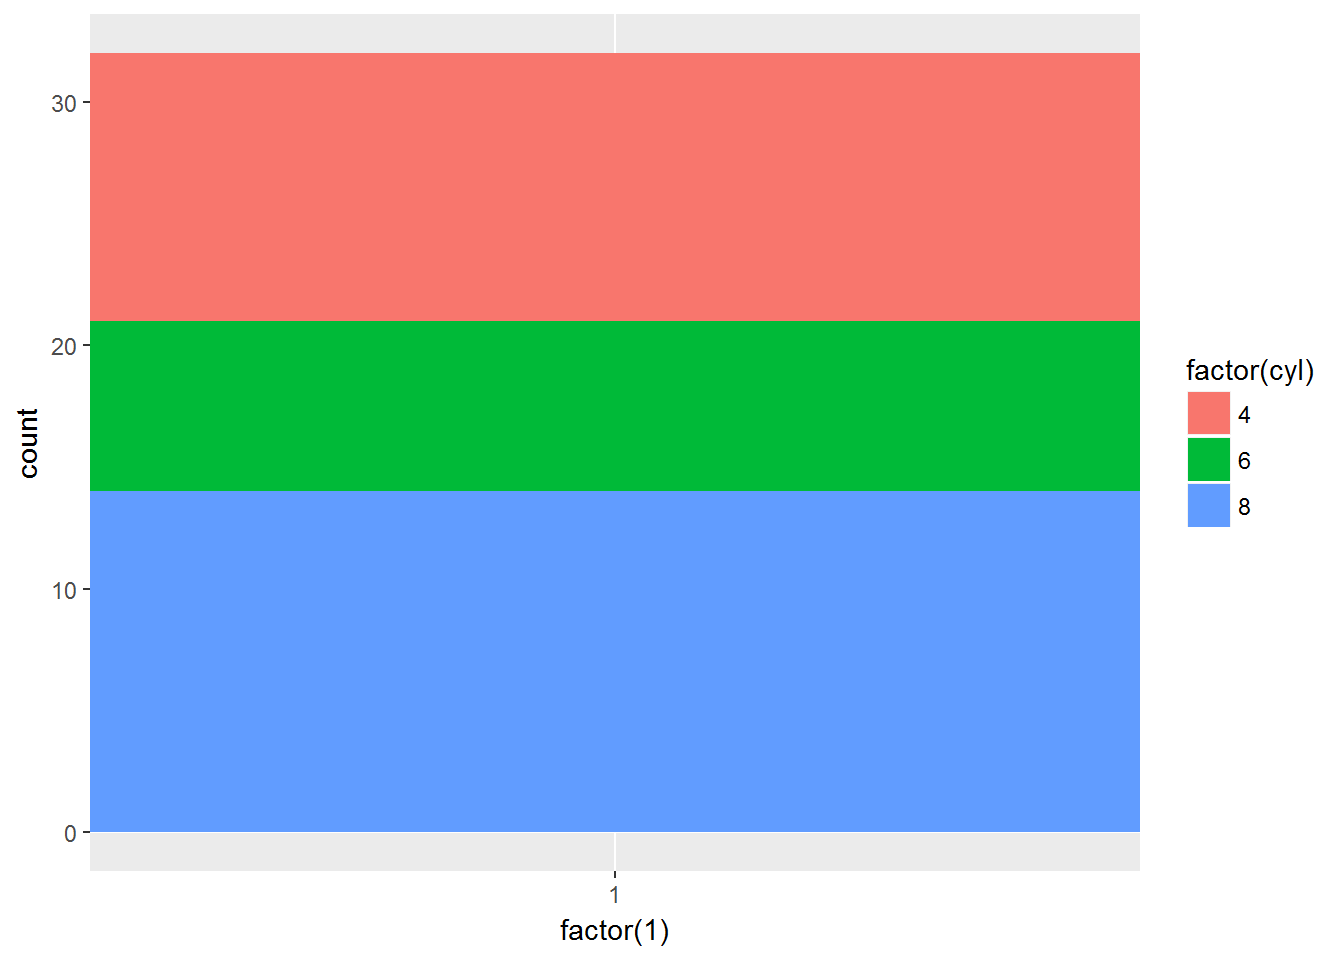
# geom_bar + coord_polar + theme_bw
g <- ggplot(data=mtcars, aes(x=factor(1), fill=factor(cyl)))
g <- g + geom_bar(width=1)
g <- g + coord_polar(theta='y')
g + theme_bw()