Section 13 Grammar of Graphics
The original R graphics package is referred to as
base graphics.Grammar of Graphics: ggplot2 by Hadley Wickham
Grammar of Graphics
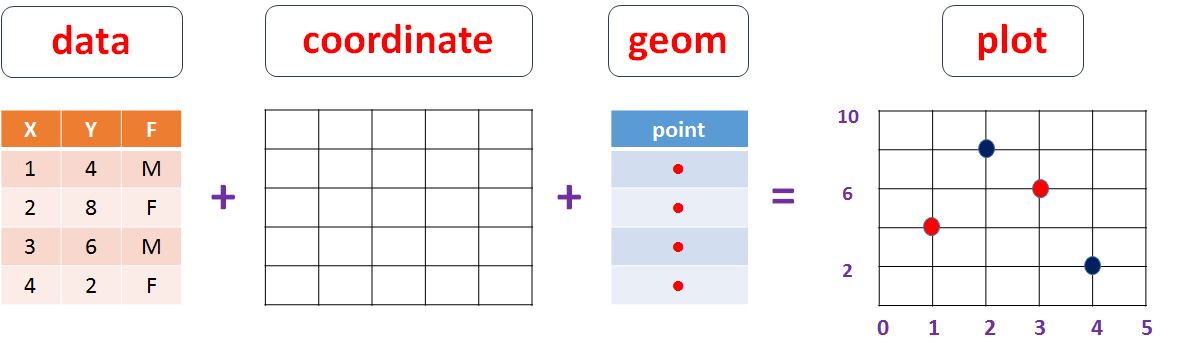
In brief, the grammar tells us that a statistical graphic is a mapping from data to aesthetic attributes (colour, shape, size) of geometric objects (points, lines, bars). The plot may also contain statistical transformations of the data and is drawn on a specific coordinates system.
13.1 Essential part
| Arguments | Explanation |
|---|---|
| data= | The DATA that you want to plot |
| geom_ | The GEOMETRIC shapes that will represent the data. |
| aes() | AESTHETICS of the geometric and statistical objects, such as color, size, shape and position. |
13.2 Advanced part
| Arguments | Explanation |
|---|---|
| stat_ | STATISTICAL summaries of the data that can be plotted, such as quantiles, fitted curves (loess, linear models, etc.), sums and so o. |
| scale_ | MAP between the data and the aesthetic dimensions, such as data range to plot width or factor values to colors |
| coord_ | The transformation used for mapping data COORDINATES into the plane of the data rectangle. |
| facet_ | The arrangement of the data into a grid of plots |
| theme | The overall visual THEMES of a plot: background, grids, axe, default typeface, sizes, colors, etc. |
The
datais what we want to visualize. It consists of variables, which are stored as columns in adata.frame.The
geomis the geometric objects that are drawn to represent the data, such as bars, lines, and points - what the data would look like. For manygeomoptions, there is equivalentstatoptions. For example,geom_boxplotandstat_boxplot.The
aesis aesthetic attribute, or aesthetics, are visual properties of geoms, such as x and y position, line color, point shapes, etc. The aesthetic mapping maps the data values to aesthetics - how the data be presented.