Section 32 Labels: labs
32.1 Modify axis, legend, and plot labels
32.1.1 Functions
labs(...)
xlab(label)
ylab(label)
ggtitle(label, subtitle = NULL)
32.1.2 Arguments
... : A list of new name-value pairs. The name should either be an aesthetic, or one of “title”, “subtitle”, or “caption”.
label : The text for the axis, plot title or caption below the plot.
subtitle : The text for the subtitle for the plot which will be displayed below the title.
32.2 Default labels
# Simple
g <- ggplot(data=iris,
            mapping=aes(x=Species, y=Sepal.Length, fill=Species))
g <- g + geom_boxplot()
g + theme_bw()
32.3 ggtitle, xlab, ylab
g <- ggplot(data=iris,
            mapping=aes(x=Species, y=Sepal.Length, fill=Species))
g <- g + geom_boxplot()
g <- g + ggtitle(label = 'Boxplot of iris data', subtitle = 'Based on iris data')
g <- g + xlab(label = 'Species of Iris')
g <- g + ylab(label = 'Sepal Length (cm)')
g + theme_bw()
32.4 labs
g <- ggplot(data=iris,
mapping=aes(x=Species, y=Sepal.Length, fill=Species))
g <- g + geom_boxplot()
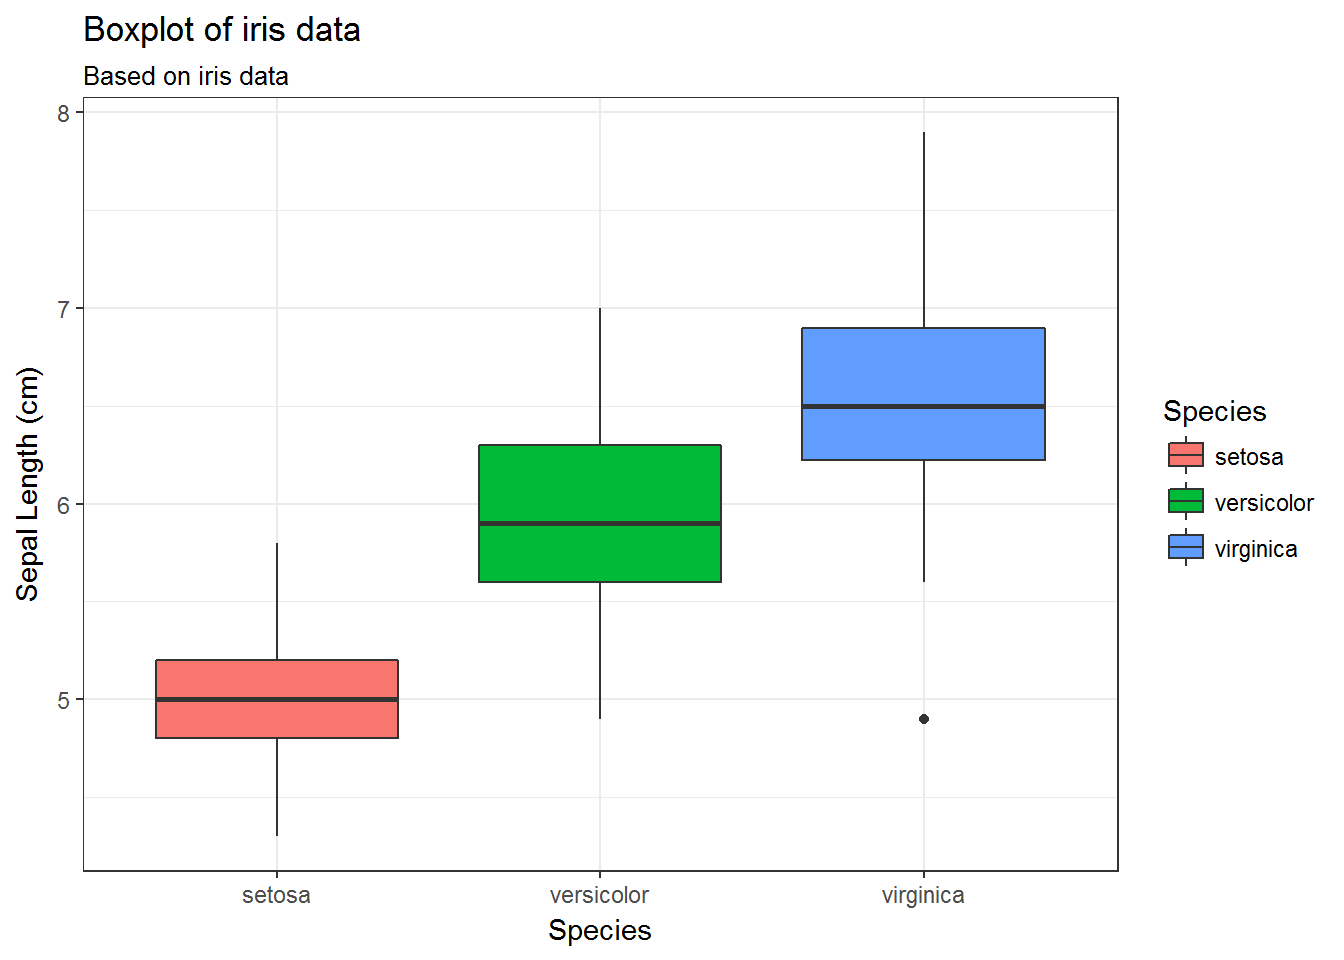
g <- g + labs(title='Boxplot of iris data',
subtitle = 'Based on iris data',
x='Species',
y='Sepal Length (cm)')
g + theme_bw()