Section 29 Numerics & Factor: geom_histogram
The geom function geom_histogram map the data to histogram.
29.1 Example 1:
data(iris)
?geom_histogram
# geom_histogram

g <- ggplot(data=iris, mapping=aes(x=Sepal.Length, fill=Species))
g <- g + geom_histogram()
g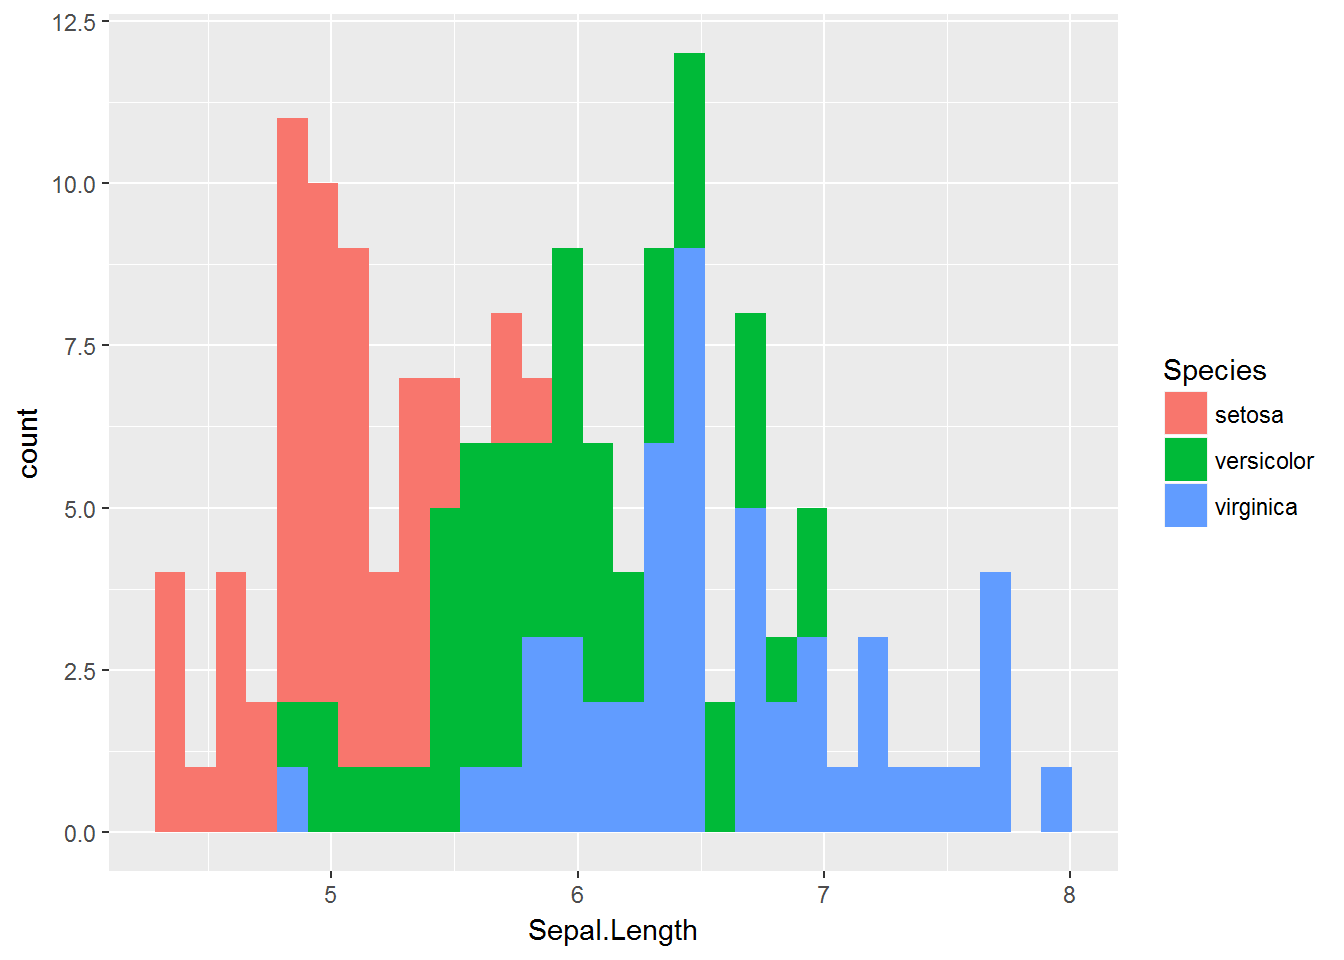
# bins

g <- ggplot(data=iris, mapping=aes(Sepal.Length, fill=Species))
g <- g + geom_histogram(bins=40)
g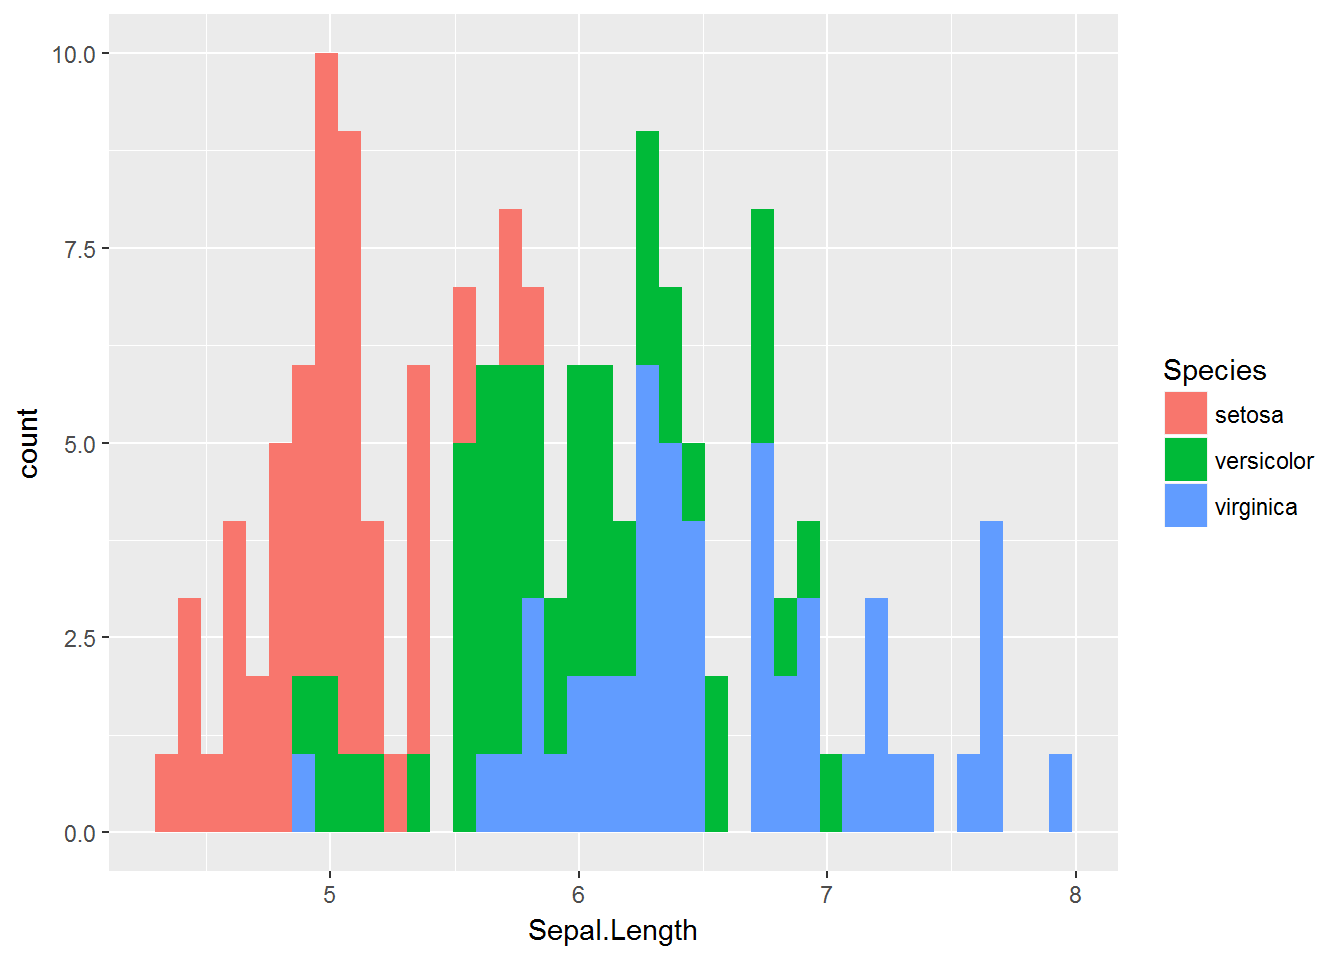
# binwidth

g <- ggplot(data=iris, mapping=aes(Sepal.Length, fill=Species))
g <- g + geom_histogram(binwidth=0.10)
g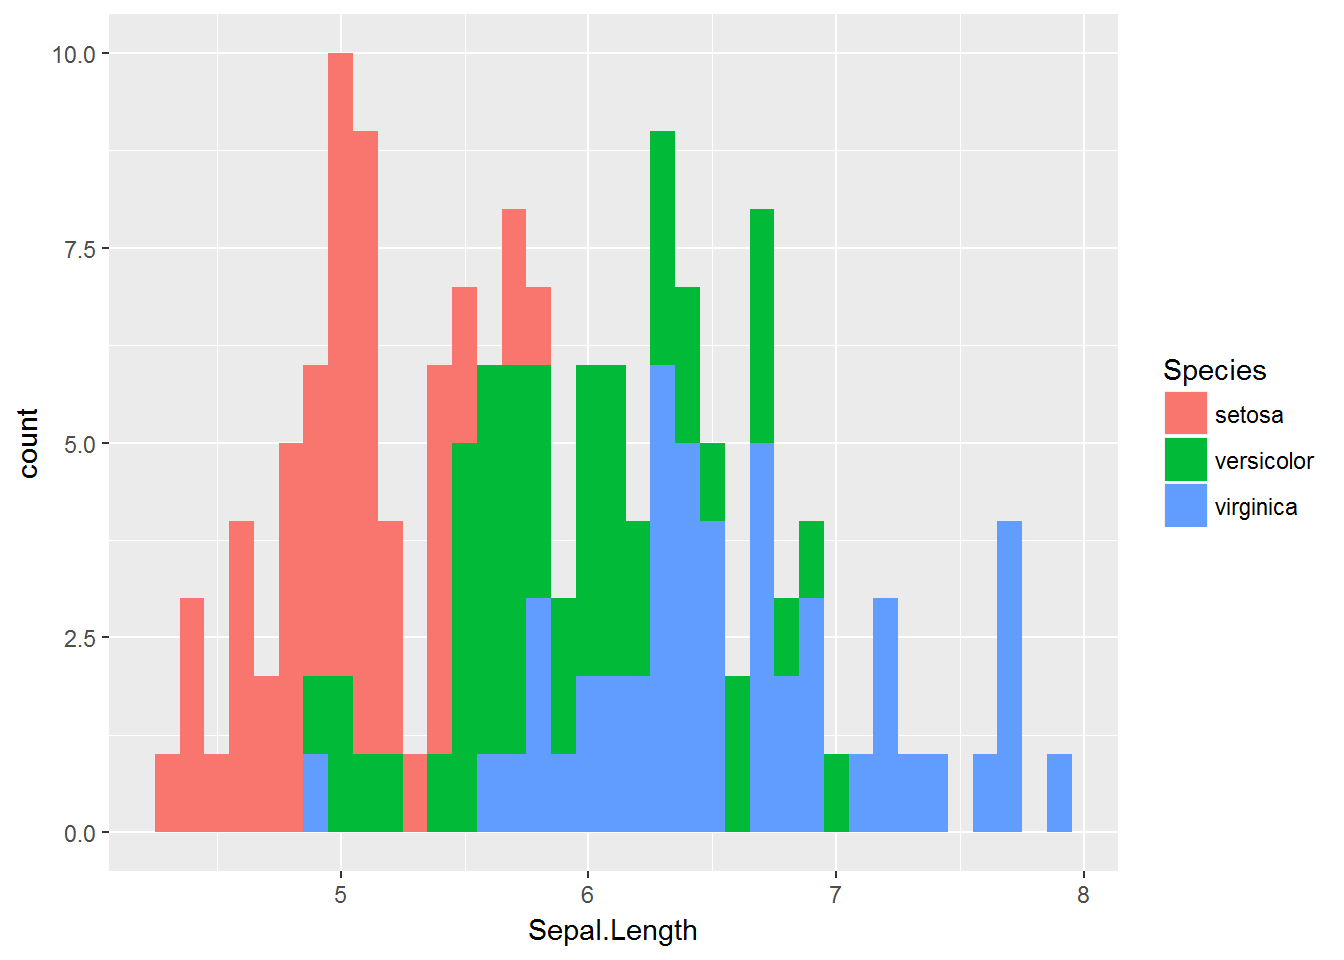
# alpha, position='identity'

g <- ggplot(data=iris, mapping=aes(Sepal.Length, fill=Species))
g <- g + geom_histogram(binwidth=0.10, alpha=0.50, position='identity')
g
# position='dodge'
g <- ggplot(data=iris, mapping=aes(Sepal.Length, fill=Species))
g <- g + geom_histogram(binwidth=0.10, alpha=0.50, position='dodge')
g
# labs
g <- ggplot(data=iris, mapping=aes(Sepal.Length, fill=Species))
g <- g + geom_histogram(binwidth=0.10, alpha=0.50, position='identity')
g <- g + labs(title='Histogram of Sepal Length',
              subtitle='Based on Iris data',
              x='Sepal Length (cm)',
              y='Count')
g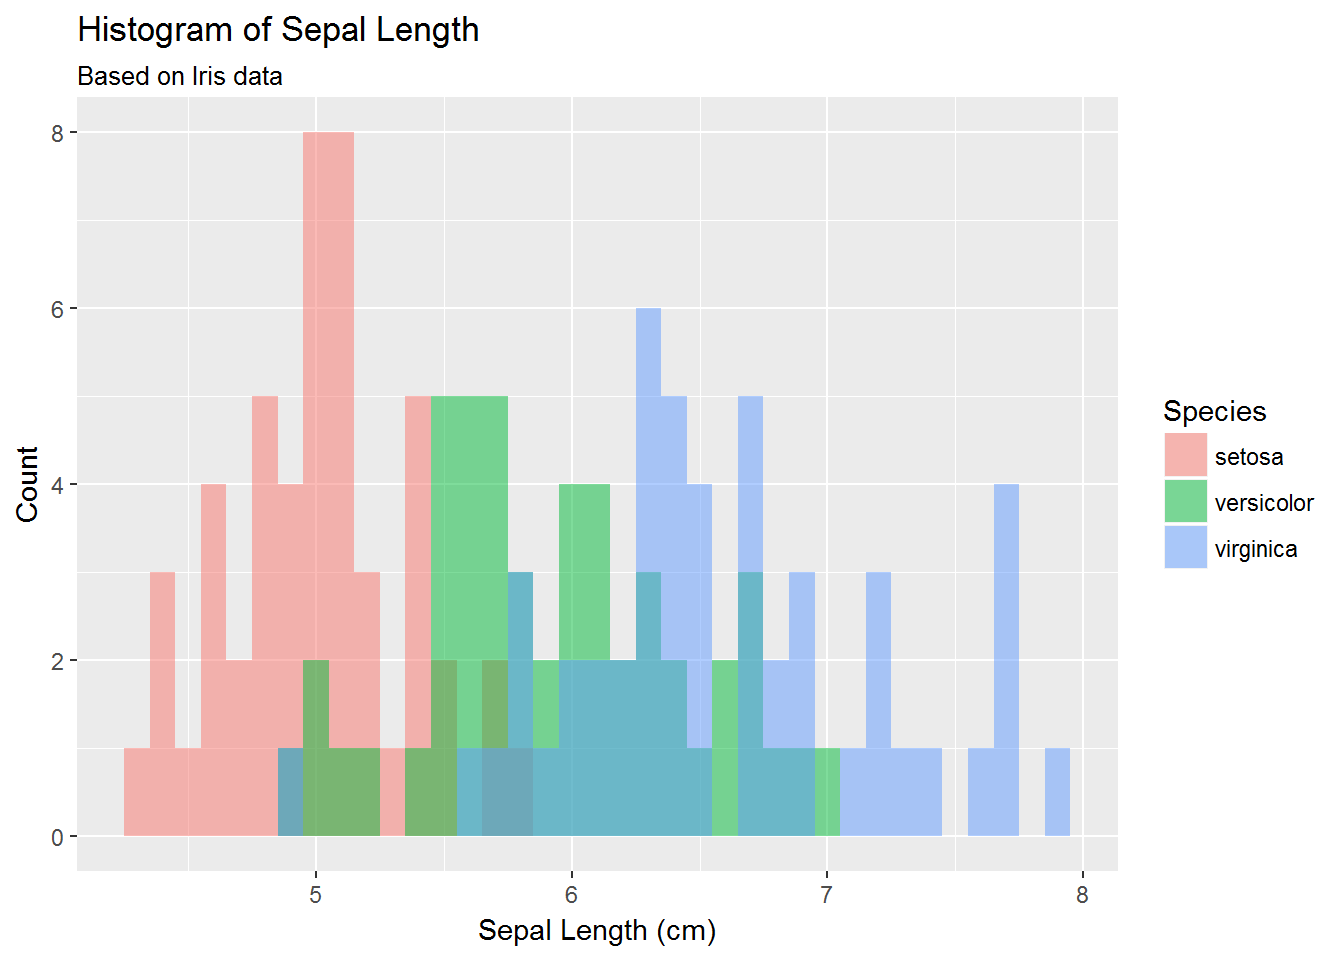
# density
g <- ggplot(data=iris, mapping=aes(Sepal.Length, fill=Species))
g <- g + geom_histogram(mapping=aes(y=..density..),
                        binwidth=0.10, alpha=0.50, position='identity')
g <- g + labs(title='Histogram of Sepal Length',
              subtitle='Based on Iris data',
              x='Sepal Length (cm)',
              y='Density')
g + theme_bw()
# histogram & density
g <- ggplot(data=iris, mapping=aes(Sepal.Length, fill=Species))
g <- g + geom_histogram(mapping=aes(y=..density..),
                        binwidth=0.10, alpha=0.80, position='identity')
g <- g + geom_density(mapping=aes(Sepal.Length, fill=Species), alpha=0.50)
g <- g + labs(title='Histogram of Sepal Length',
              subtitle='Based on Iris data',
              x='Sepal Length (cm)',
              y='Density')
g + theme_bw()
29.2 Example 2:
data(iris)
Draw vertical lines showing the mean of Sepal.Length for each species as shown in the following plot.

29.3 Example 3:
data(warpbreaks)
Draw a histogram of the variable
breaksforwoolDraw a histogram of the variable
breaksfortensionDraw a histogram of the variable
breaksfor interaction ofwoolandtensionDiscuss the histogram
Transform the data using log-transformation and redraw the histogram