Section 25 Multiple Plot Layout: facet_grid
The function facet_grid forms a matrix of panels defined by row and column facetting variables. It is most useful when you have two discrete variables, and all combinations of the variables exist in the data.
25.1 Function
facet_grid(facets, margins = FALSE, scales = "fixed", space = "fixed", shrink = TRUE, labeller = "label_value", as.table = TRUE, switch = NULL, drop = TRUE)
25.2 Columns
g <- ggplot(mpg, aes(displ, cty)) + geom_point()

g + facet_grid(. ~ cyl)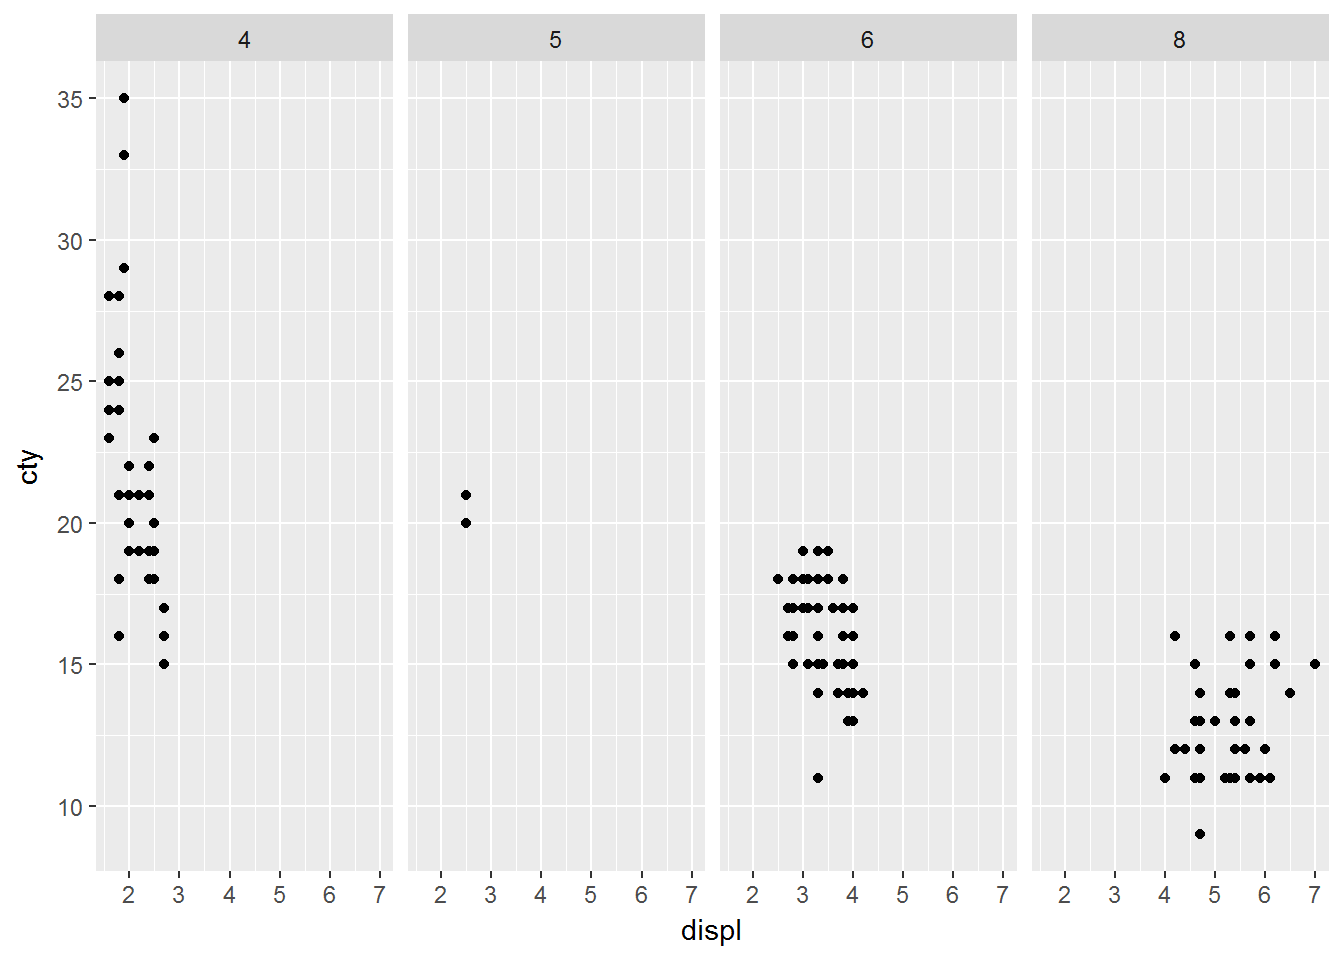
25.3 Rows
g + facet_grid(drv ~ .)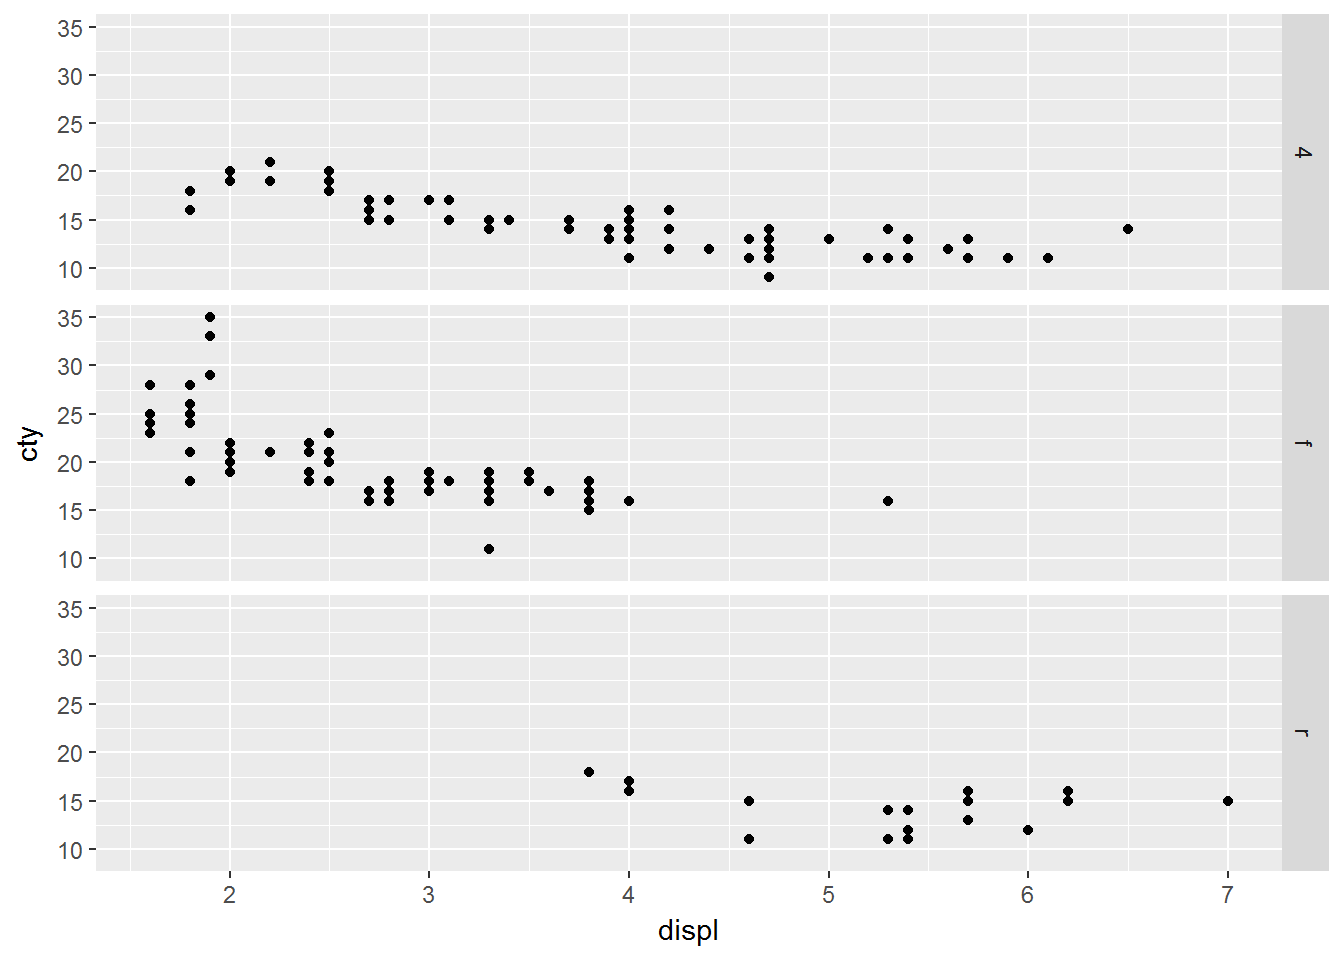
25.4 Rows x Columns
g + facet_grid(drv ~ cyl)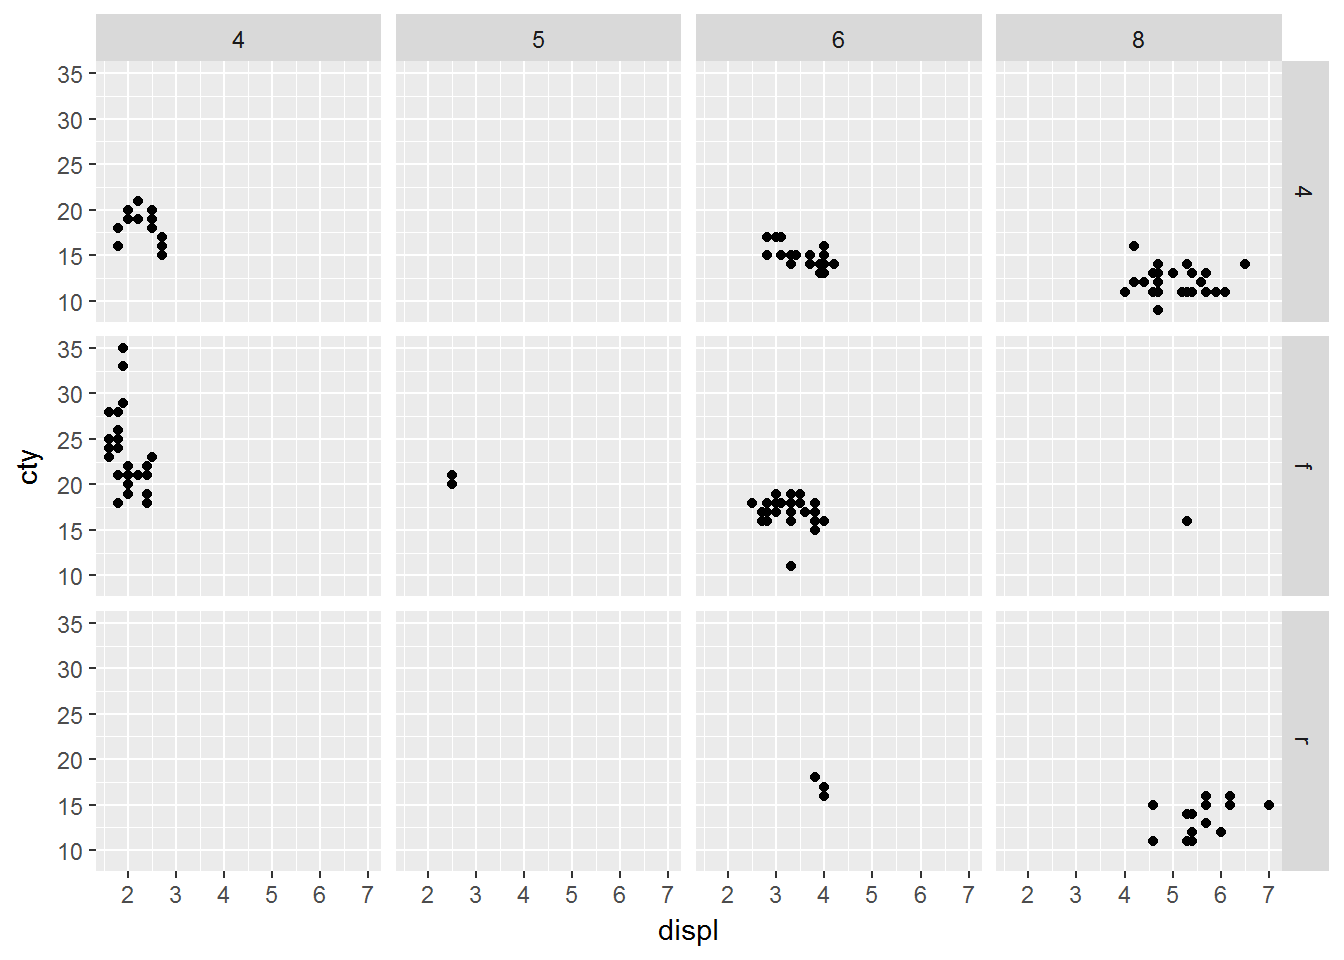
25.5 scales = "free"
g <- ggplot(mtcars, aes(mpg, wt, colour = factor(cyl))) +
  geom_point()

g + facet_grid(. ~ cyl, scales = "free")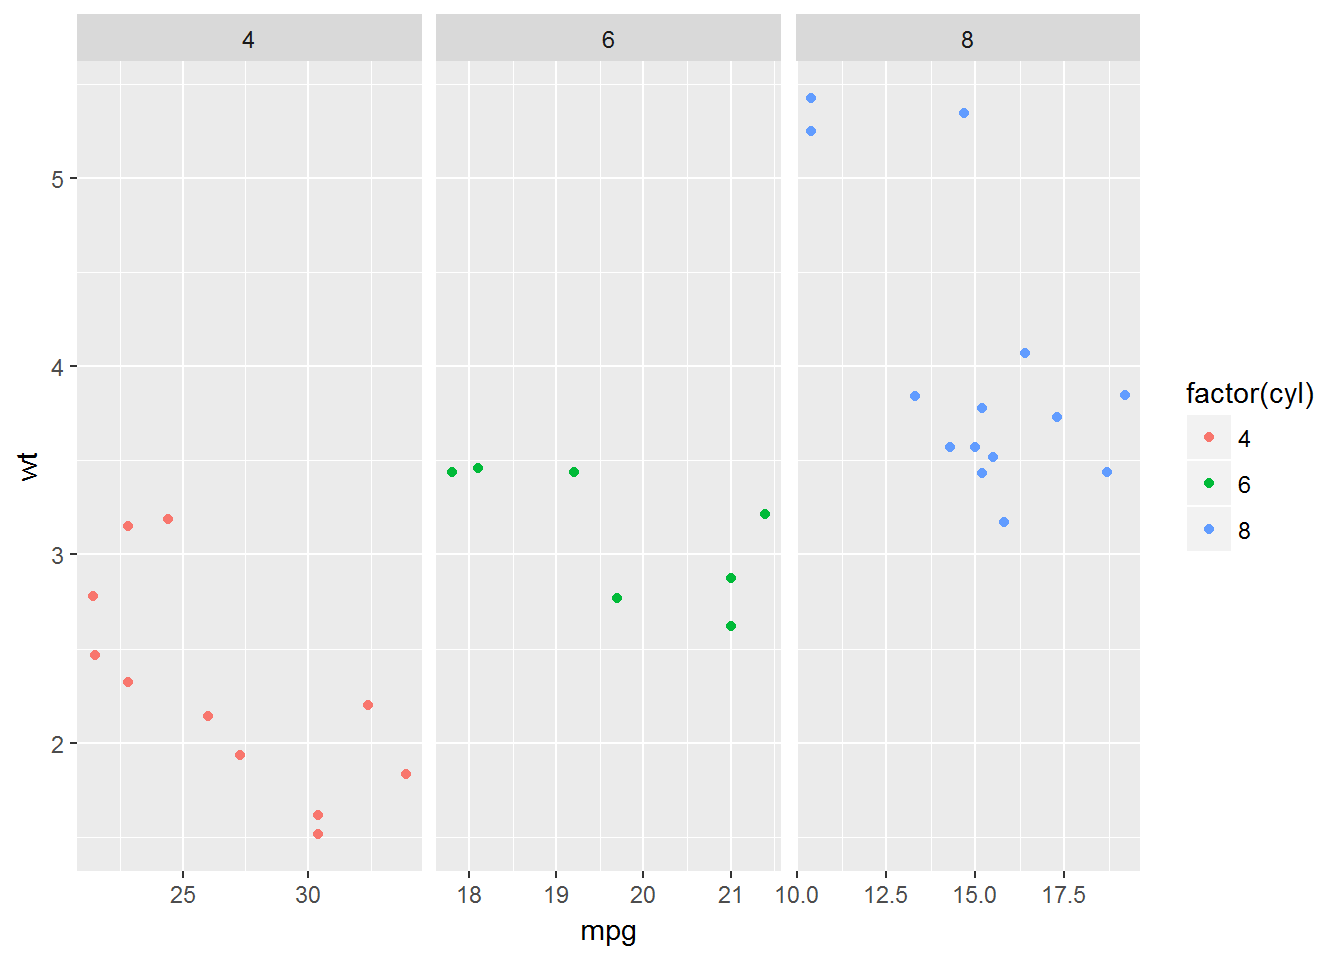
25.6 Multiple row variables
g <- ggplot(mtcars, aes(mpg, wt, colour = factor(cyl))) +
  geom_point()

g + facet_grid(vs + am ~ gear)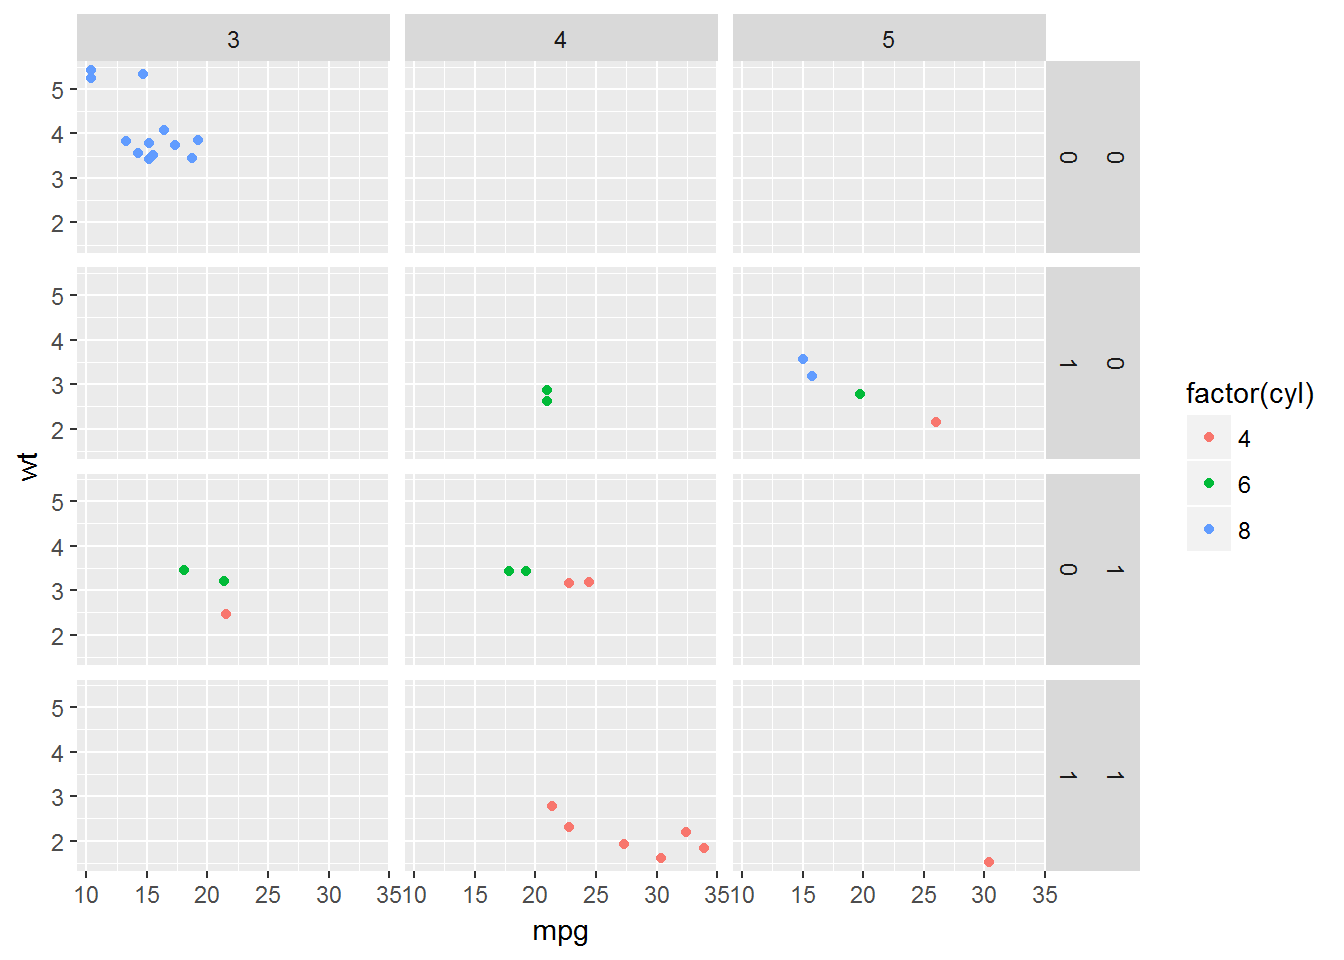
Note: Use the labeller option to control how labels are printed on the panels.
25.7 Exercise
Compare hwy against displ for different levels of cyl and drv from the mpg data.