Section 35 ggplot2 theme
Themes control the display of all non-data elements of the plot. You can override all settings with a complete theme like theme_bw(), or choose to tweak individual settings by using theme() and the element_ functions.
Use theme_set() to modify the active theme, affecting all future plots.
35.1 theme
| X.theme. | Description |
|---|---|
theme_gray |
The signature ggplot2 theme with a grey background and white gridlines, designed to put the data forward yet make comparisons easy. |
theme_bw |
The classic dark-on-light ggplot2 theme. May work better for presentations displayed with a projector. |
theme_light |
A theme similar to theme_linedraw but with light grey lines and axes, to direct more attention towards the data. |
theme_dark |
The dark cousin of theme_light, with similar line sizes but a dark background. Useful to make thin coloured lines pop out. |
theme_minimal |
A minimalistic theme with no background annotations. |
theme_classic |
A classic-looking theme, with x and y axis lines and no gridlines. |
theme_void |
A completely empty theme. |
35.2 theme_gray()
g <- ggplot(mtcars) + geom_point(aes(x = wt, y = mpg,
     colour = factor(gear))) + facet_wrap(~am)

g + theme_gray()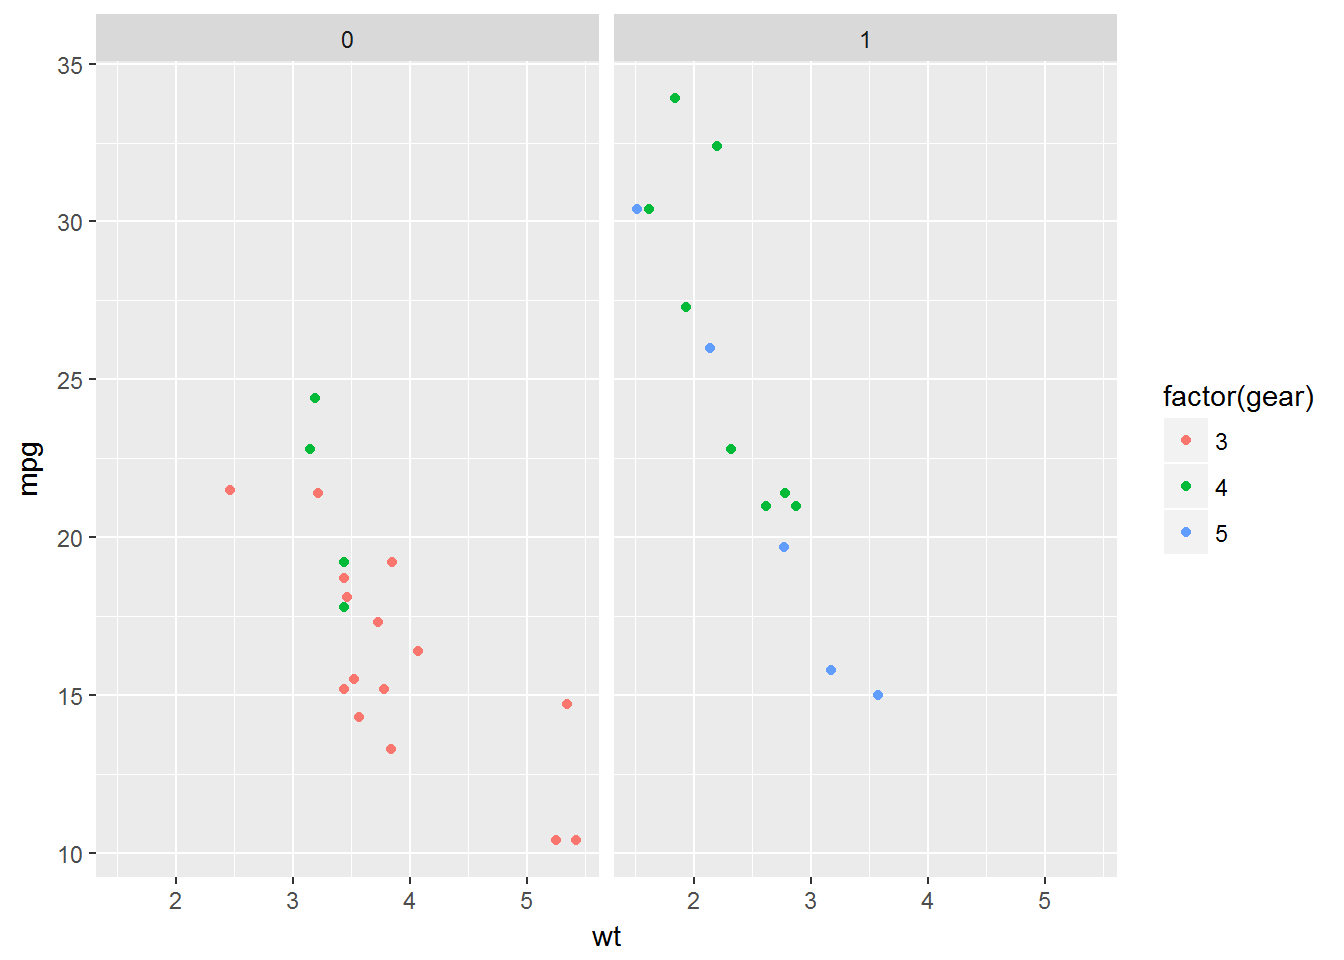
35.3 theme_bw()
g + theme_bw()
35.4 theme_light()
g + theme_light()
35.5 theme_dark()
g + theme_dark()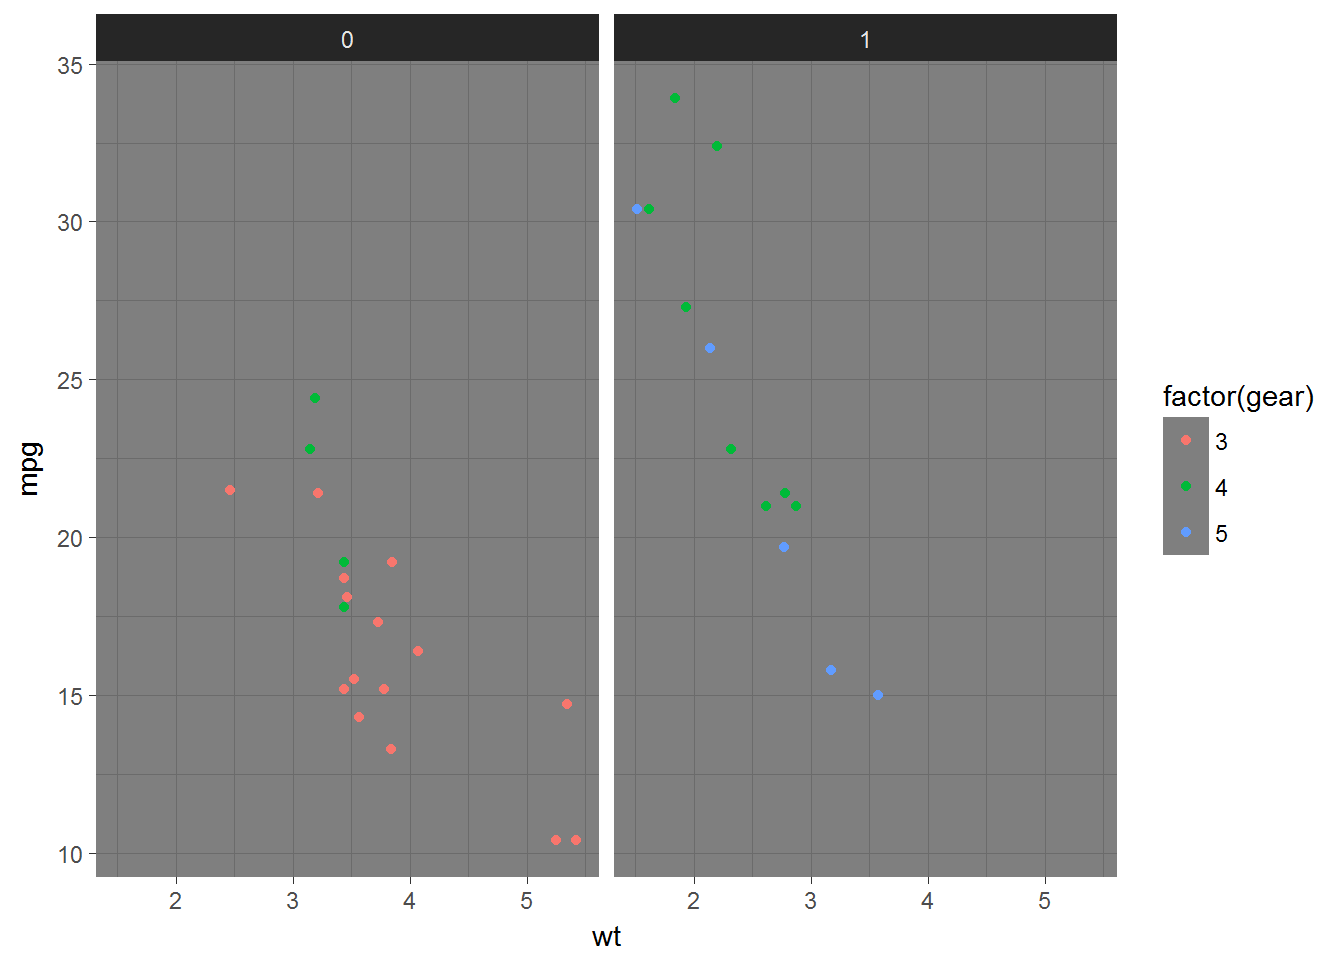
35.6 theme_minimal()
g + theme_minimal()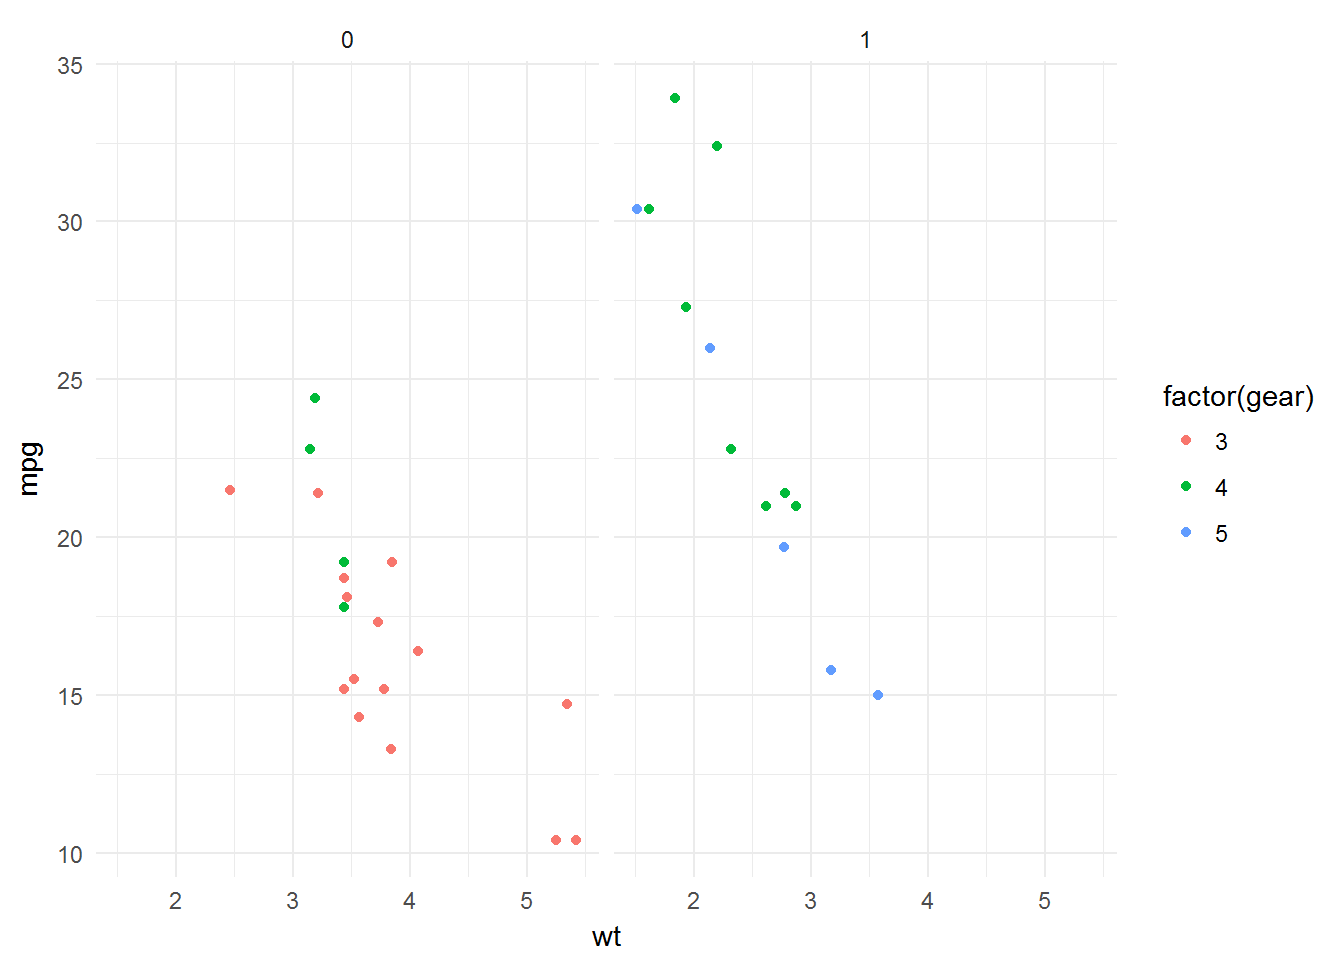
35.7 theme_classic()
g + theme_classic()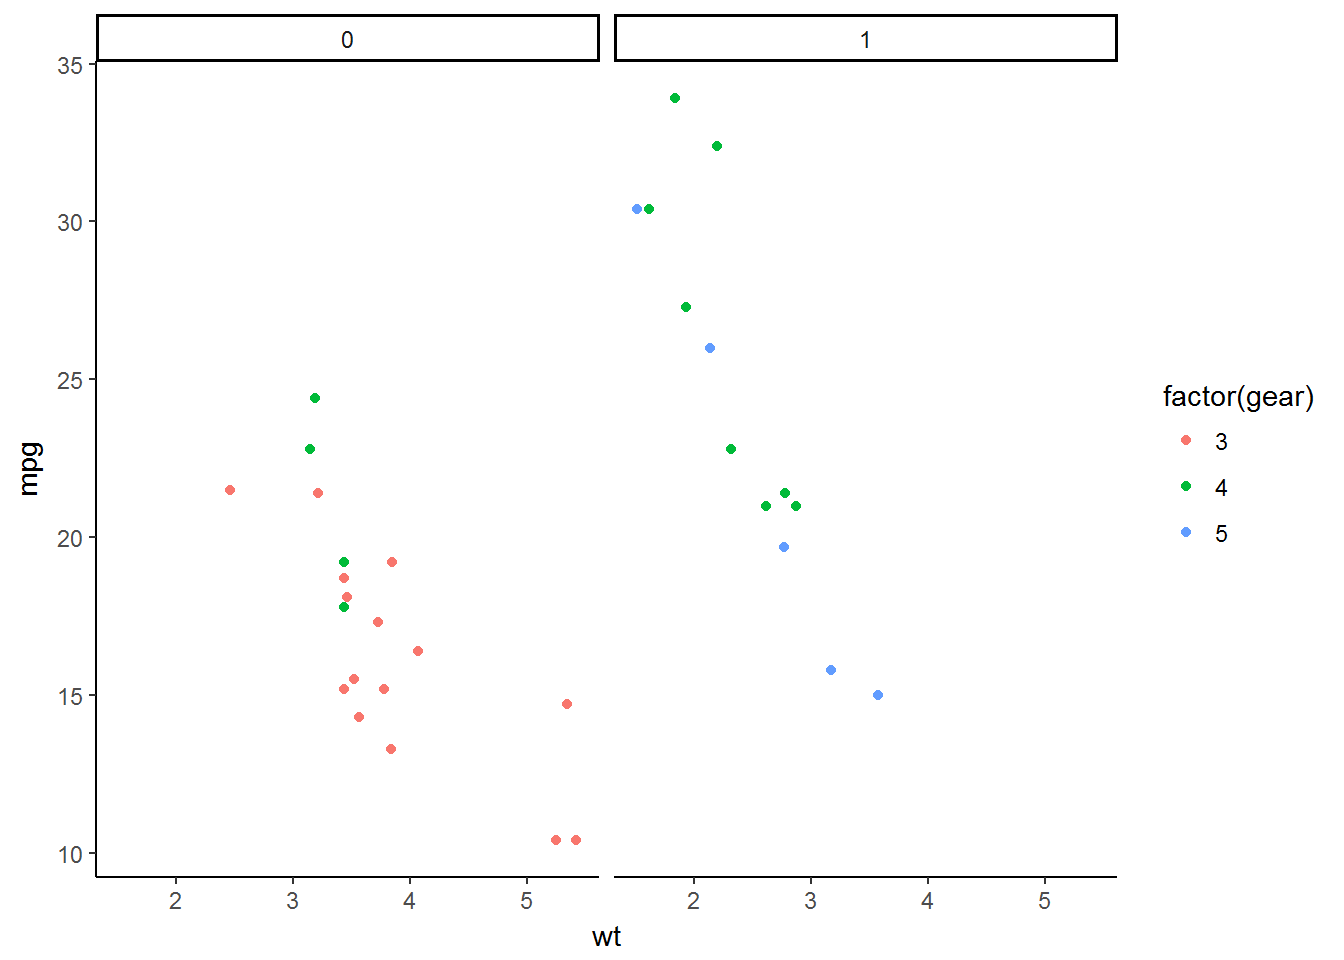
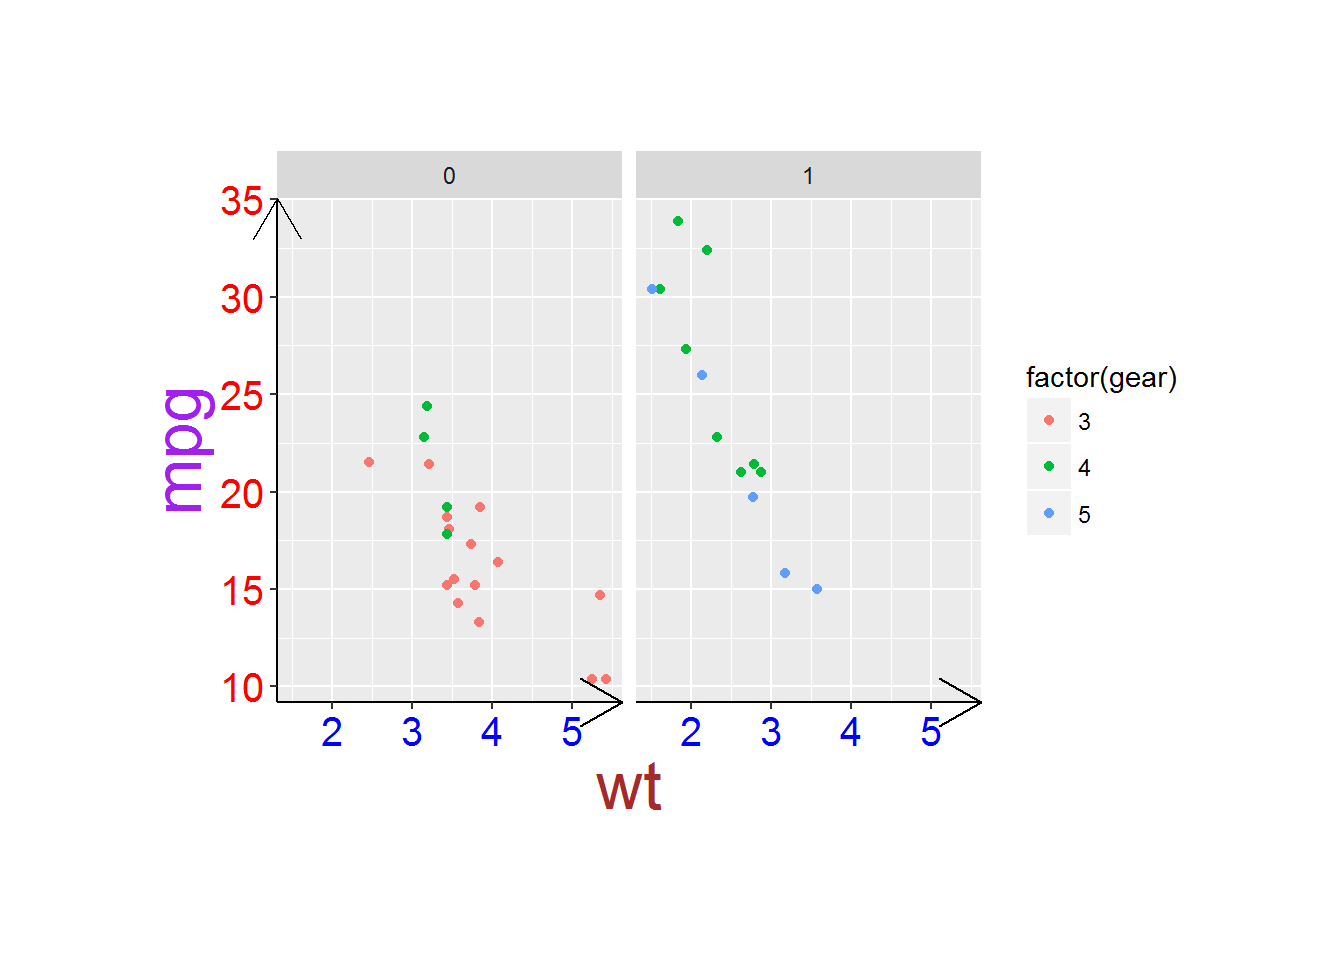
35.8 Customised theme
g + theme(plot.title=element_text(size=30, face='bold', family = 'sans'),
          axis.text.x=element_text(size=15, colour='blue'),
          axis.text.y=element_text(size=15, colour='red'),
          axis.title.x=element_text(size=25, colour='brown'),
          axis.title.y=element_text(size=25, colour='purple'),
          plot.margin = margin(2, 2, 2, 2, 'cm'),
          axis.line = element_line(arrow = arrow()))