Section 19 One Numeric: geom_boxplot
The function geom_boxplot produces the box-and-whisker plot(s) of the given values or grouped data.
19.1 Example 1:
data(iris)
?geom_boxplot
# geom_boxplot

g <- ggplot(data=iris, mapping=aes(y=Sepal.Length, x=1))
g <- g + geom_boxplot()
g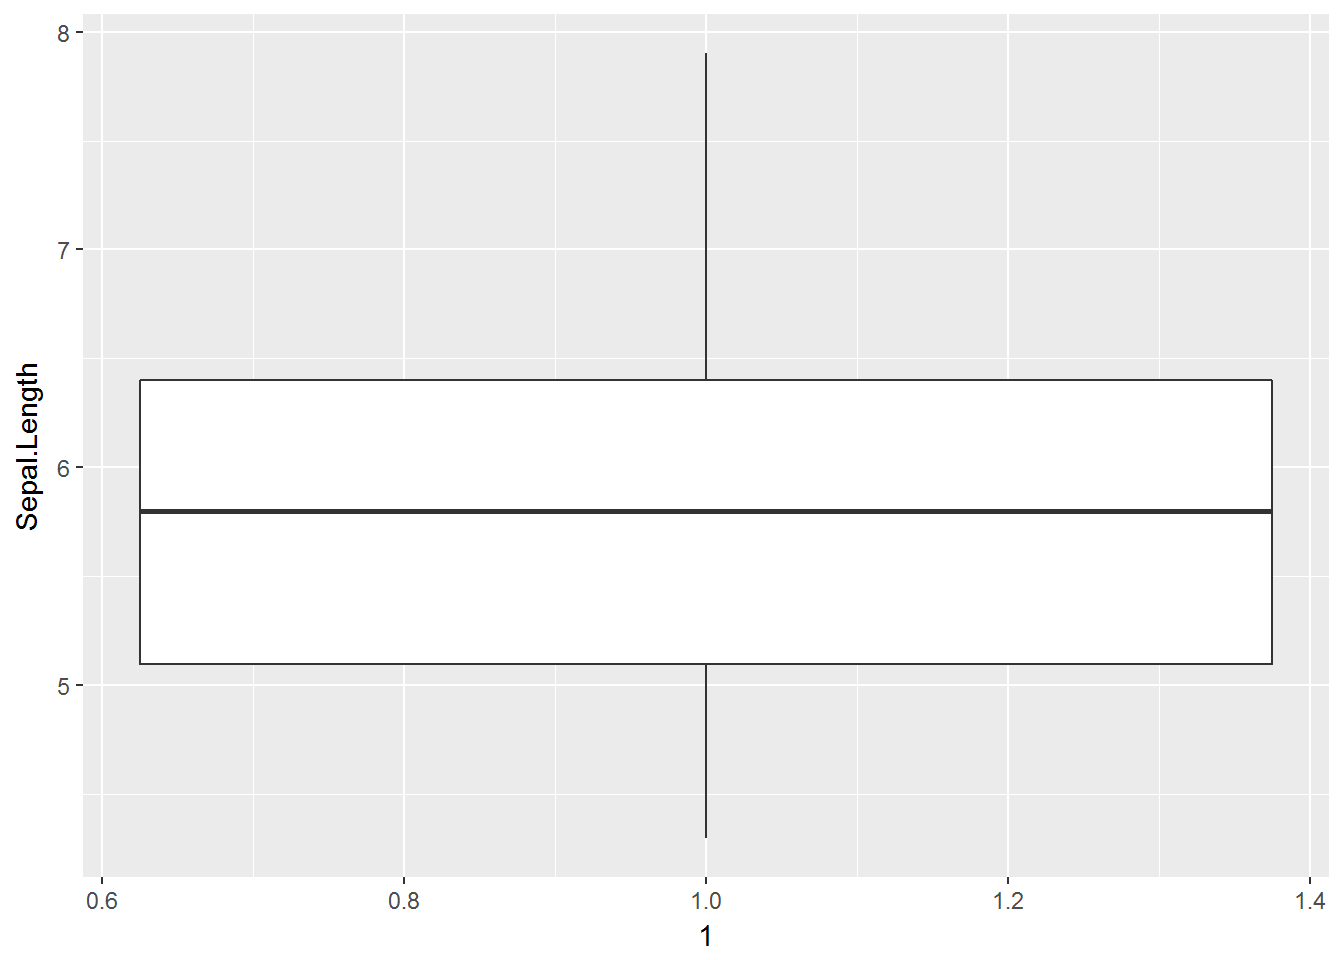
# fill & colour

g <- ggplot(data=iris, mapping=aes(y=Sepal.Length, x=1))
g <- g + geom_boxplot(fill='lightblue', colour='purple')
g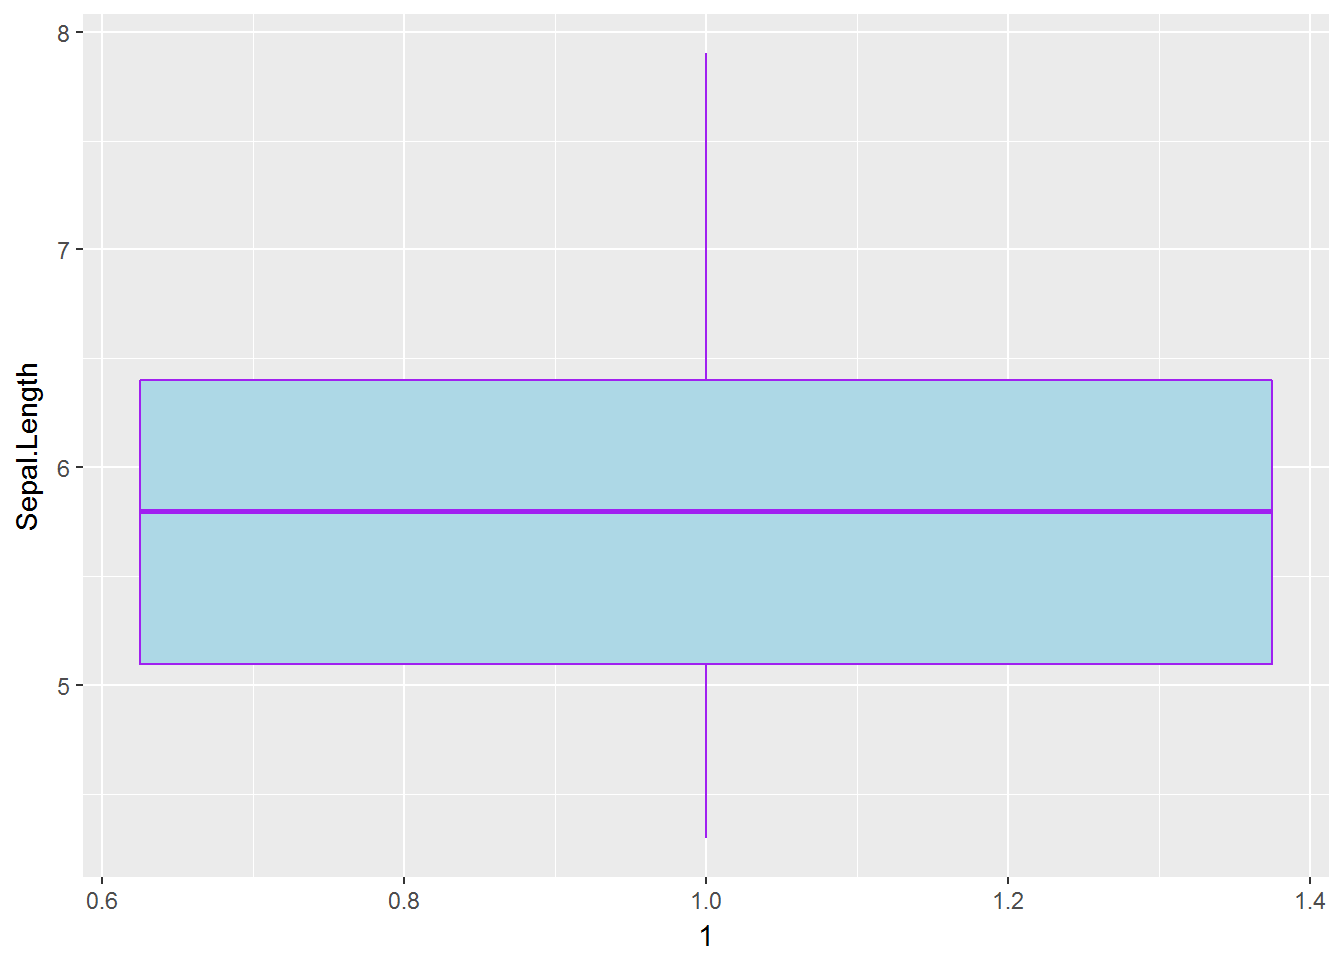
# labs

g <- ggplot(data=iris, mapping=aes(y=Sepal.Length, x=1))
g <- g + geom_boxplot(fill='lightblue', colour='purple')
g <- g + labs(title='Boxplot of Sepal Length',
              subtitle='Based on Iris data',
              x='Sepal Length (cm)',
              y='Density')
g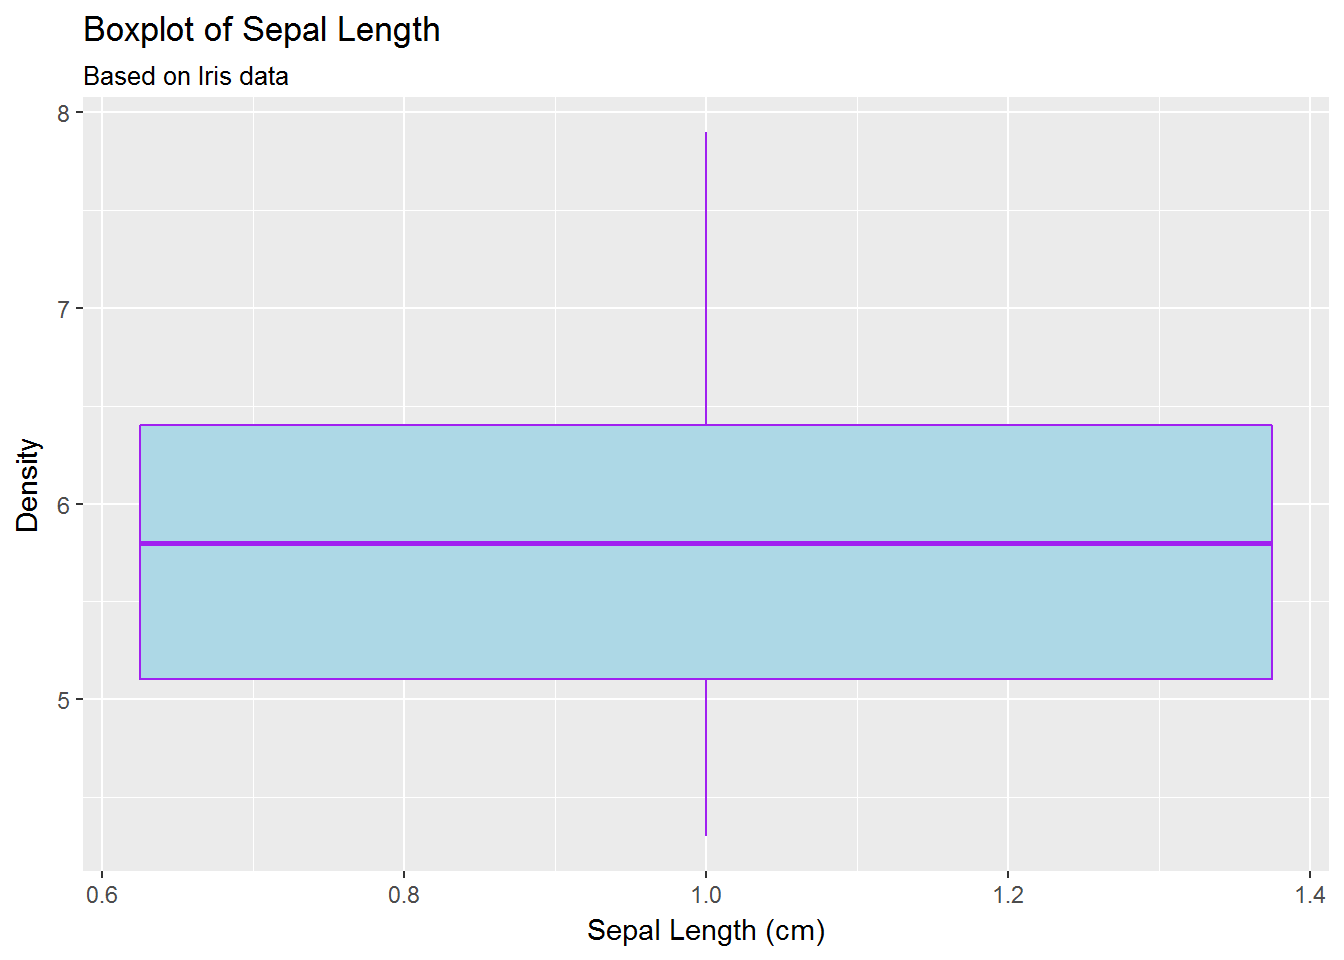
# stat_summary, theme_bw

g <- ggplot(data=iris, mapping=aes(y=Sepal.Length, x=1))
g <- g + geom_boxplot(fill='lightblue',
                      colour='purple',
                      linetype=5,
                      size=1.25)
g <- g + labs(title='Boxplot of Sepal Length',
              subtitle='Based on Iris data',
              x='Sepal Length (cm)',
              y='Density')
g <- g + stat_summary(fun.y=mean, geom='point',
                      shape=16, colour='red', size=6)
g + theme_bw()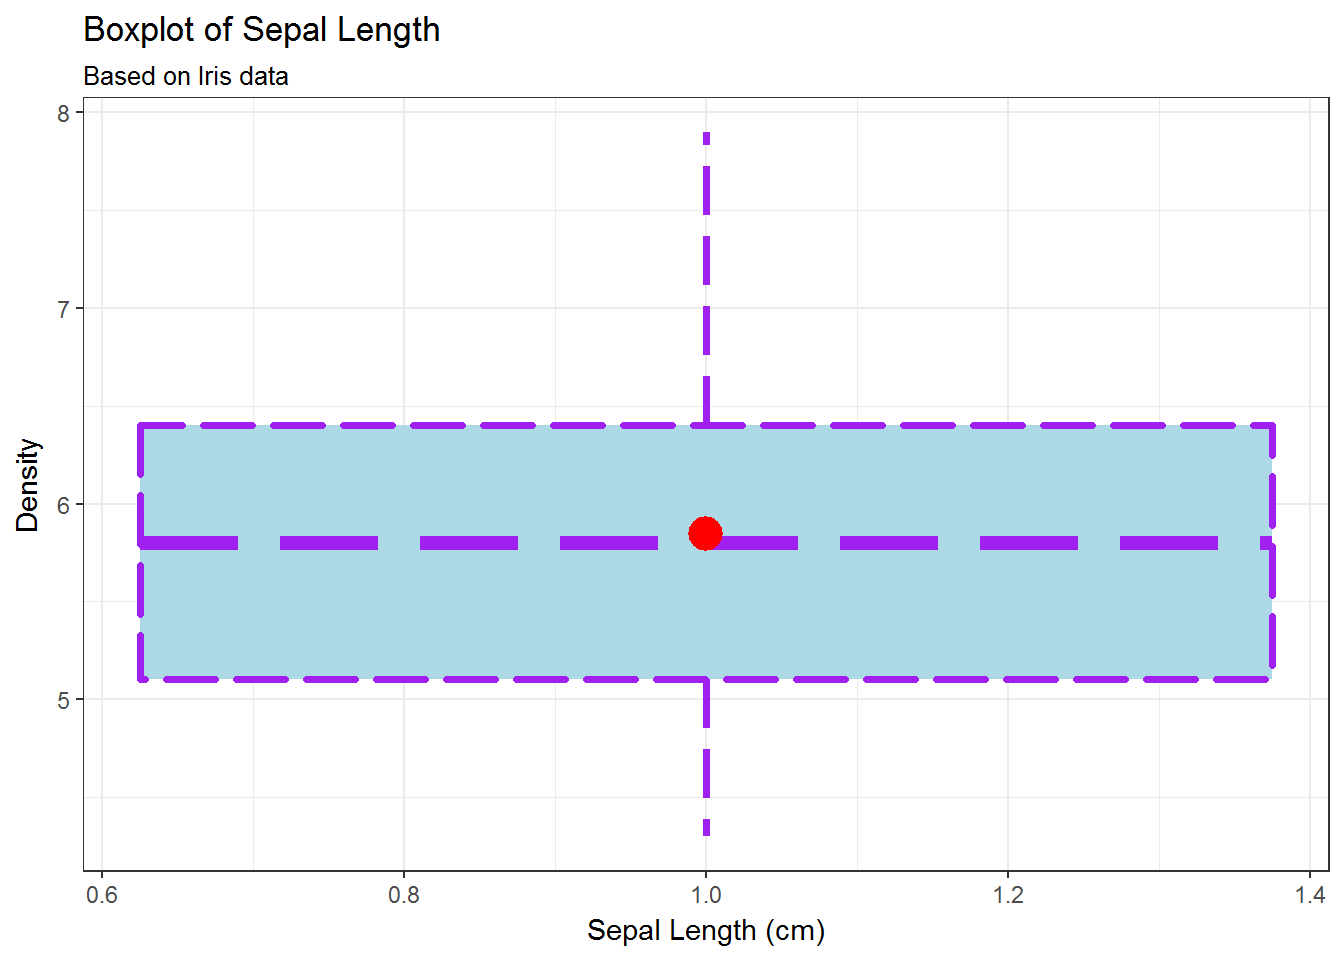
# coord_flip()

g + theme_bw() + coord_flip()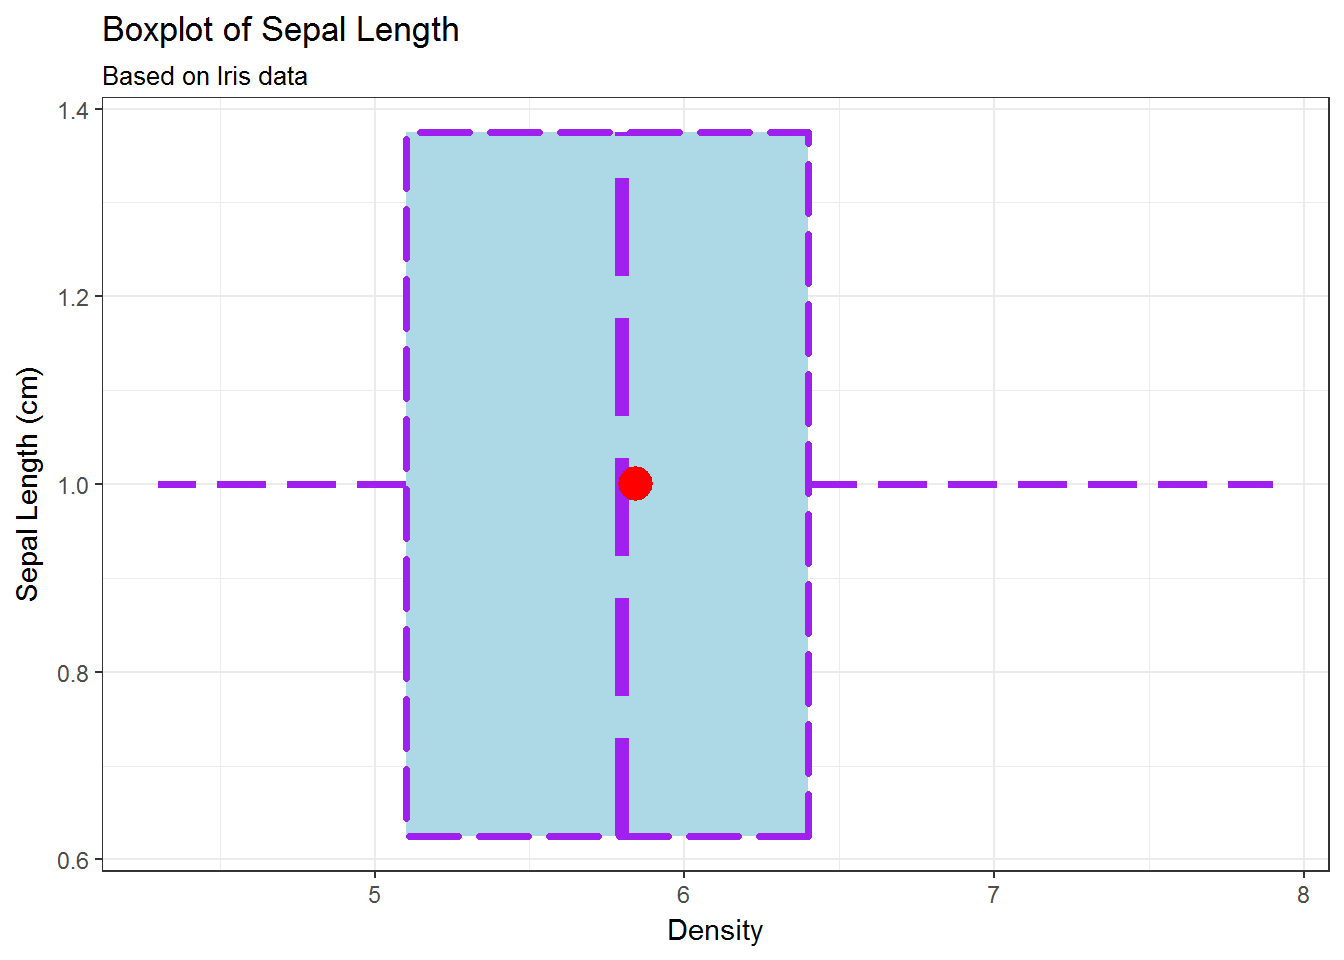
19.2 Example 2:
data(warpbreaks)
Draw a box plot of the variable
breaksDiscuss the box plot
Transform the data using log-transformation and redraw the box plot