Section 34 Continuous & Categorical: Boxplot
34.1 Box plot
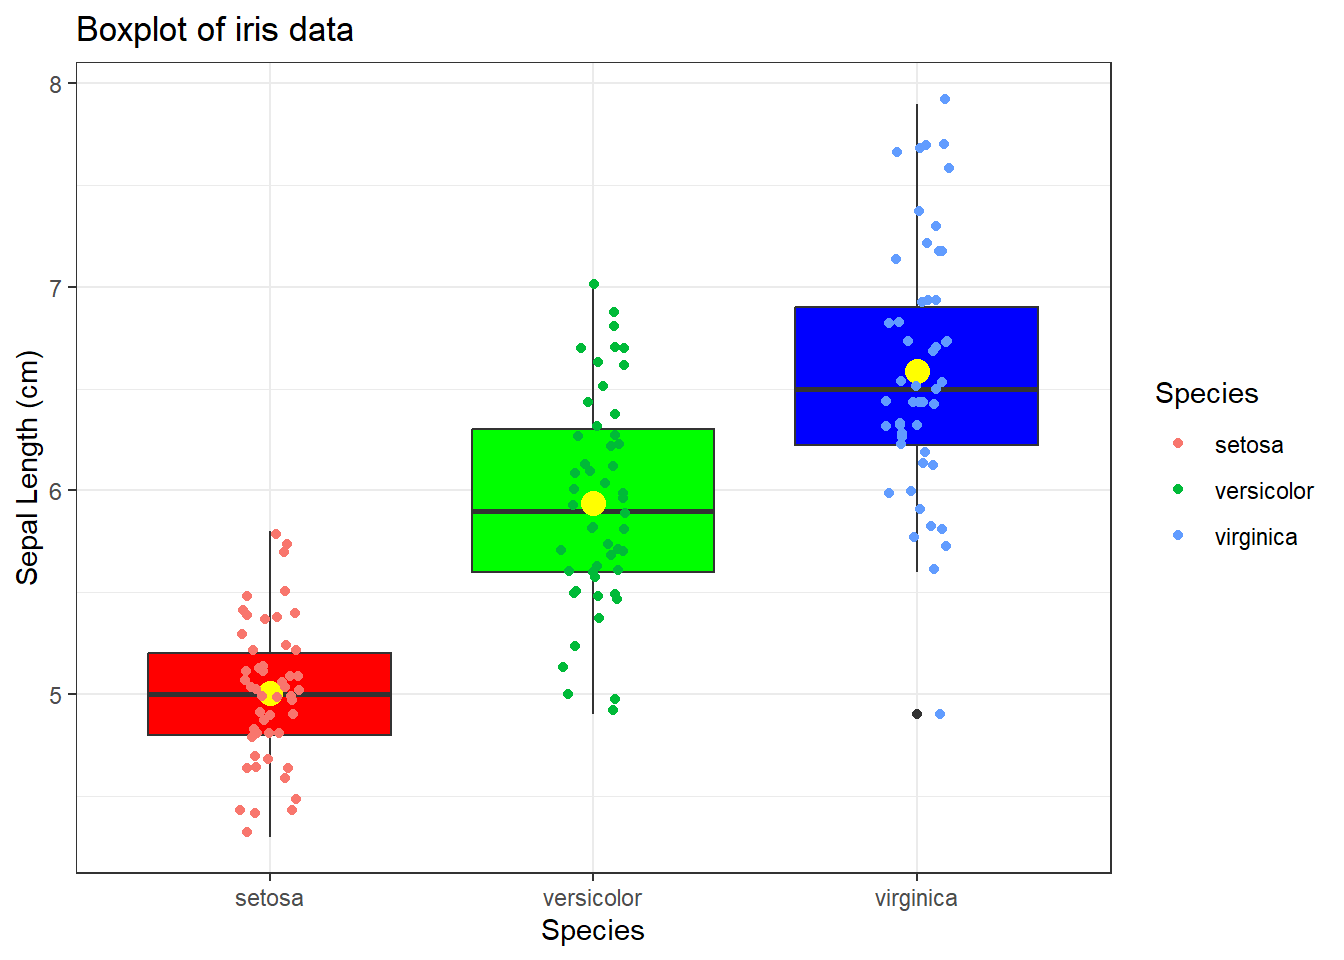
data(iris)

g <- ggplot(data=iris,
            mapping=aes(x=Species, y=Sepal.Length, fill=Species))
g <- g + geom_boxplot() + guides(fill=FALSE)
g <- g + scale_fill_manual(values=c('red','green','blue'))
g <- g + labs(title='Boxplot of iris data',
              x='Species',
              y='Sepal Length (cm)')
g <- g + stat_summary(fun.y=mean, geom='point', shape=16, size=4, colour='yellow')
g <- g + geom_jitter(mapping=aes(col=Species), width = 0.1)
g + theme_bw()