Section 20 Single Continuous Variable: Boxplot
20.2 package base
data(iris)

boxplot(x=iris$Sepal.Length, lty=1, lwd=1.25, col='lightblue',
     main='Boxplot of Sepal Length',
     xlab='All Data',
     ylab='Sepal Length (cm)',
     border='blue')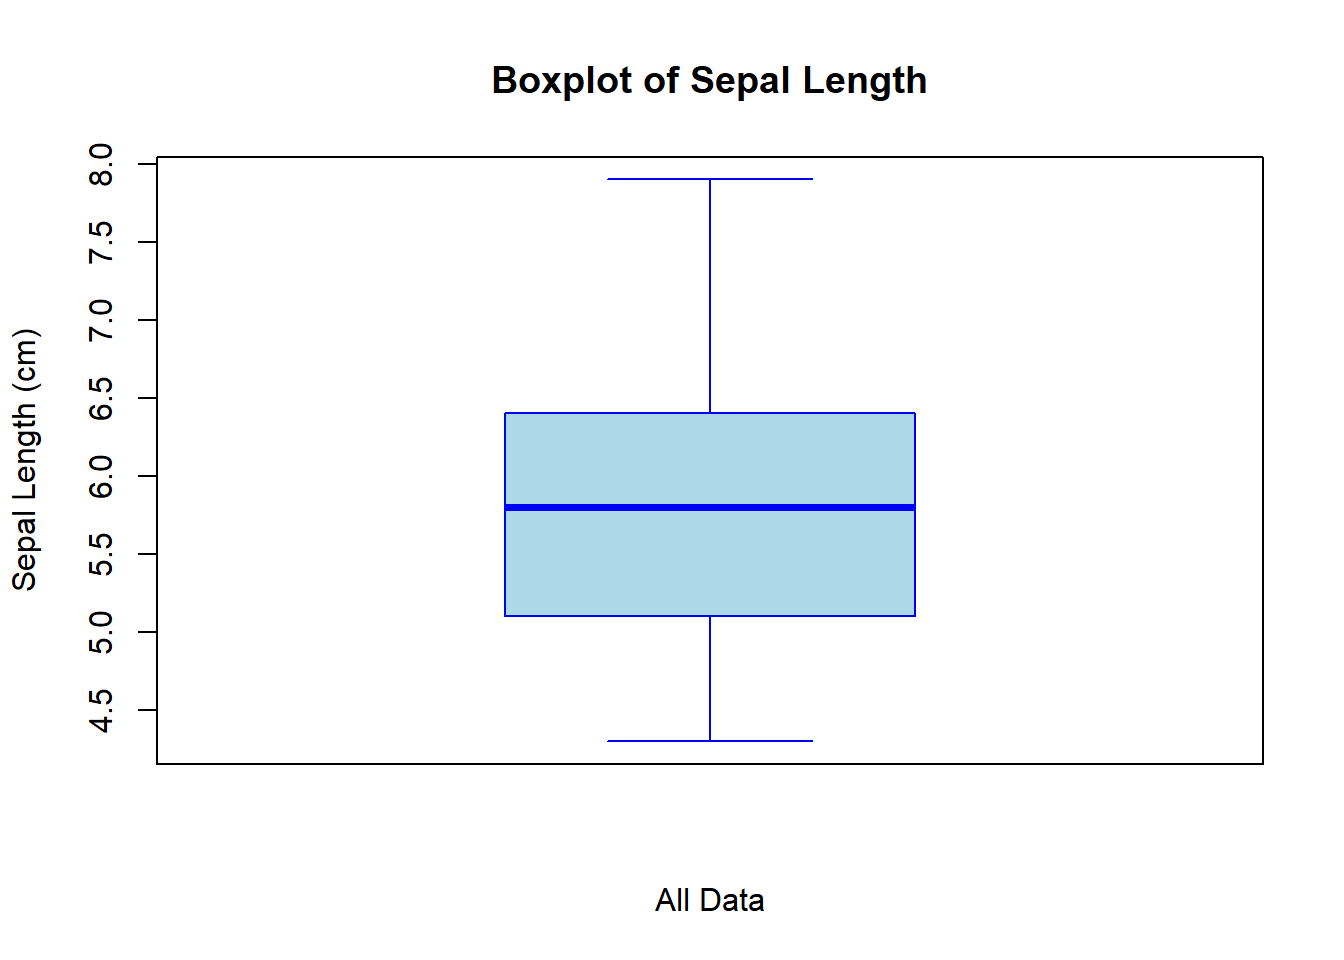
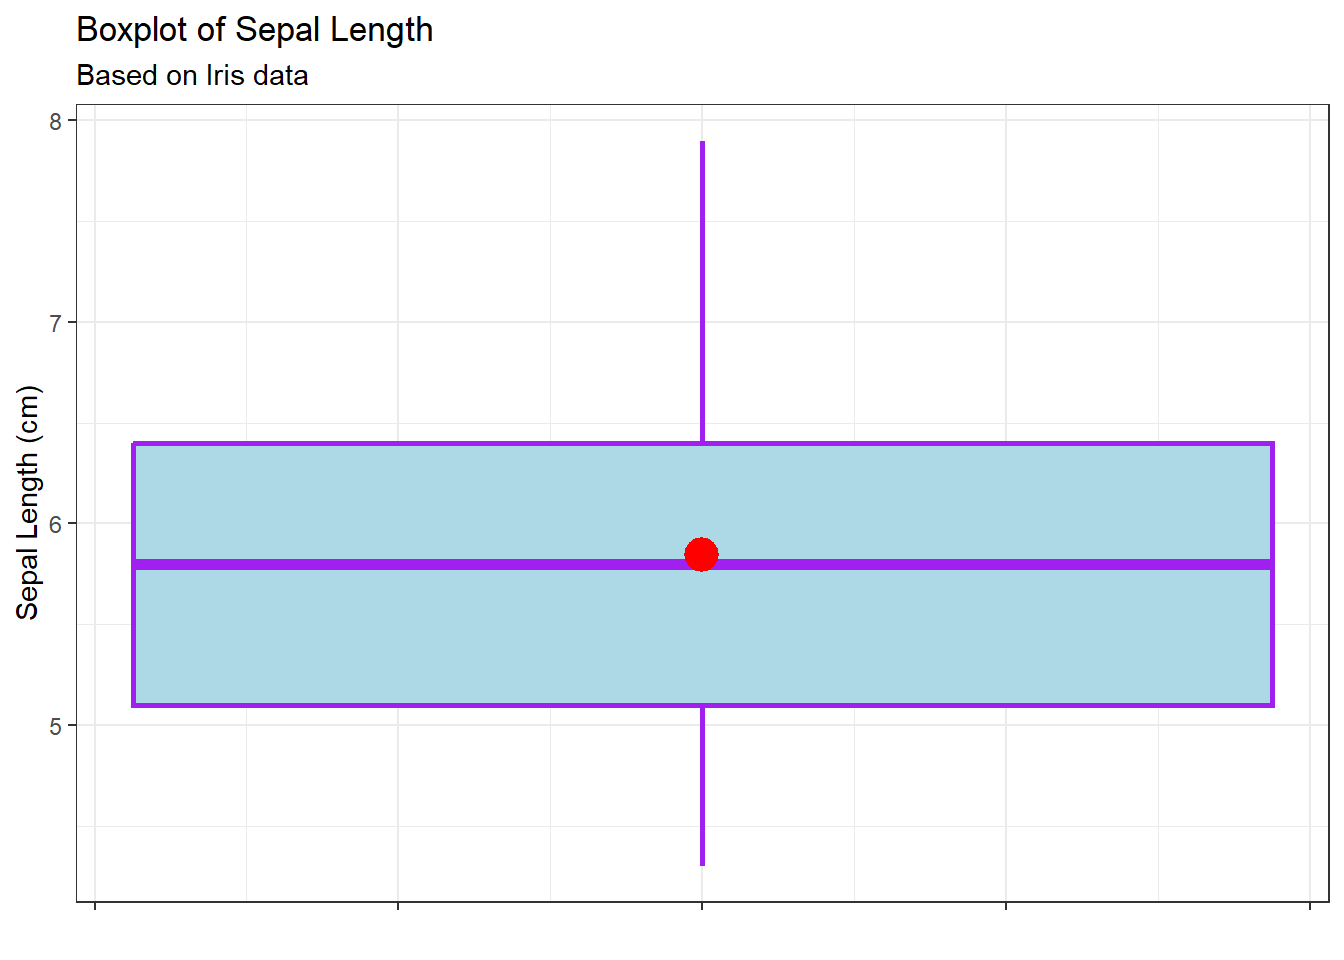
20.3 package ggplot2
g <- ggplot(data=iris, mapping=aes(y=Sepal.Length, x=1))
g <- g + geom_boxplot(fill='lightblue',
                      colour='purple',
                      linetype=1,
                      size=1)
g <- g + labs(title='Boxplot of Sepal Length',
              subtitle='Based on Iris data',
              x='', y='Sepal Length (cm)')
g <- g + stat_summary(fun.y=mean, geom='point',
                      shape=16, colour='red', size=6)
g + theme_bw() + theme(axis.text.x = element_blank())