Section 59 Normal Distribution: Exercise
59.1 Example 1
Generate 30 samples from a Normal distribution with mean 0 and sd 1.
Plot these values.
Do they look as if they come from a normal distribution?
What is their mean and sd? What values should the mean and sd have?
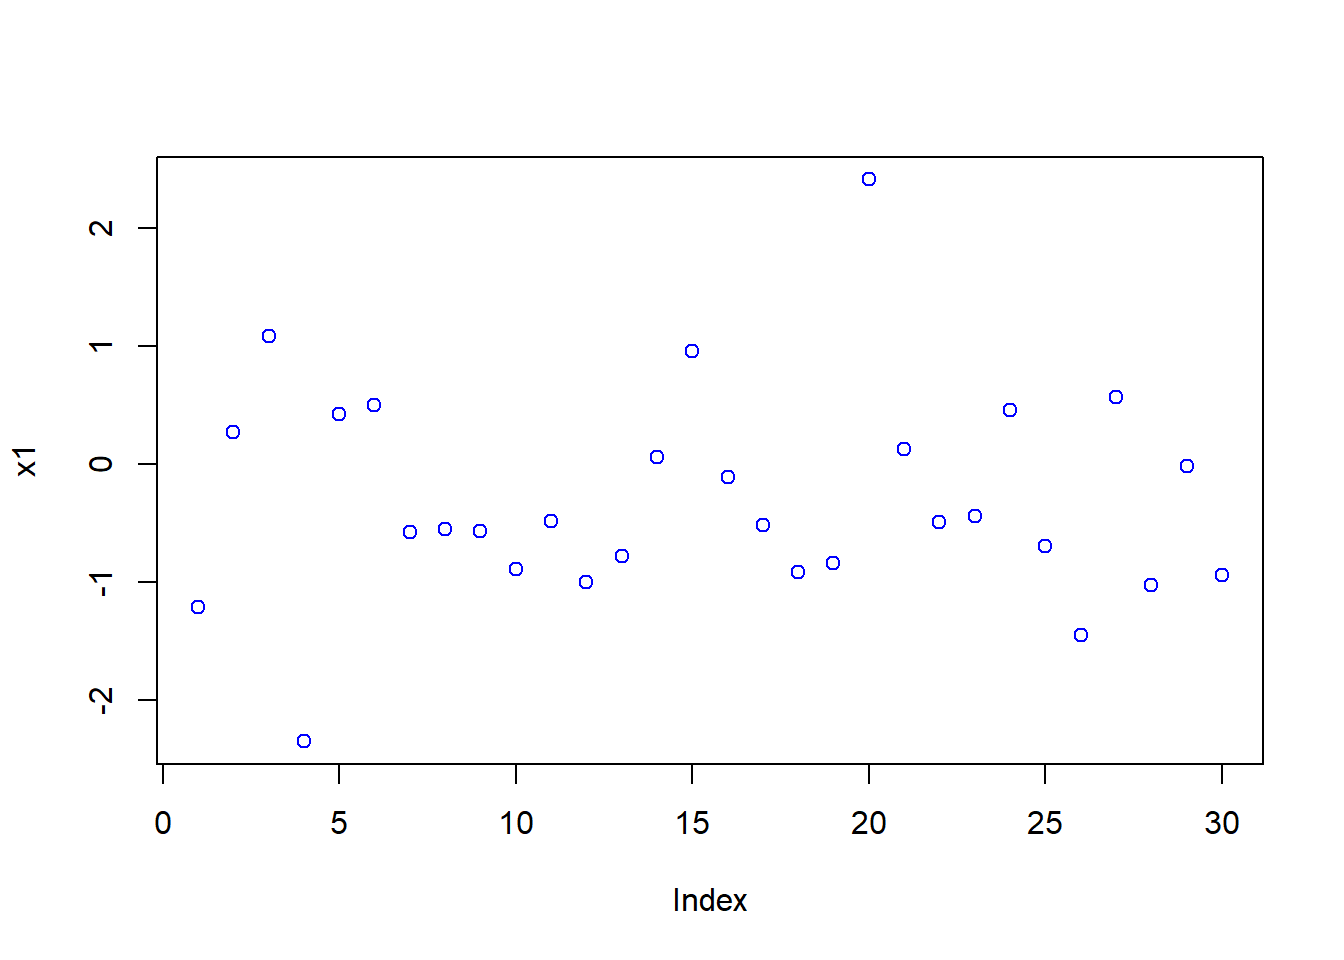
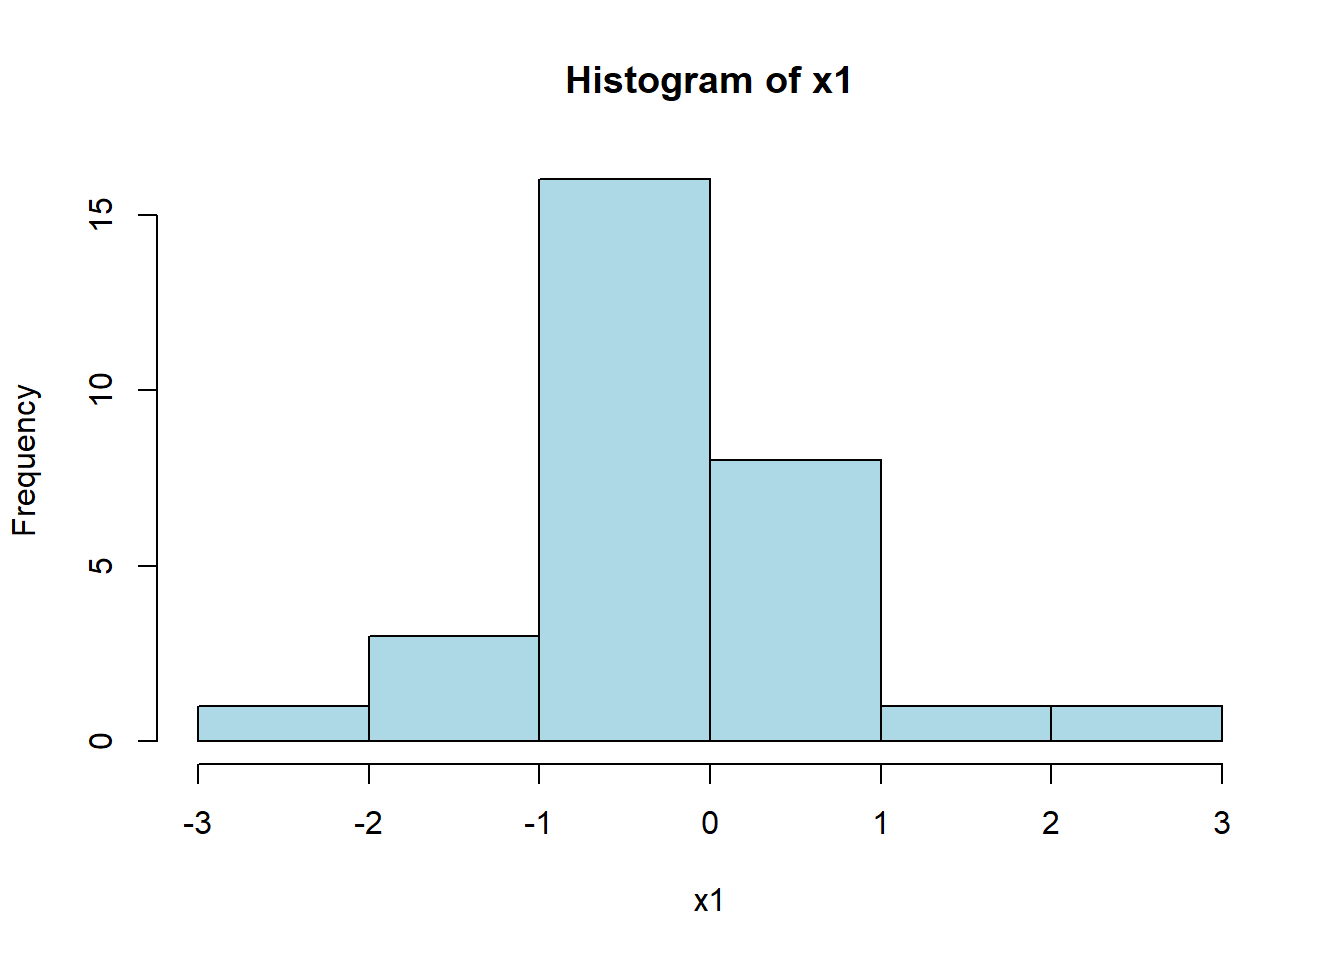
[1] -0.296425[1] 0.902983159.2 Example 2
- Generate 1000 samples from a \(N(\mu=0, \sigma=1)\) distribution.
Does this look more like a Normal than the previous example, based on 30 values?
Are the sample mean and sd closer to the true values than the previous example?
Would you expect them to be closer?
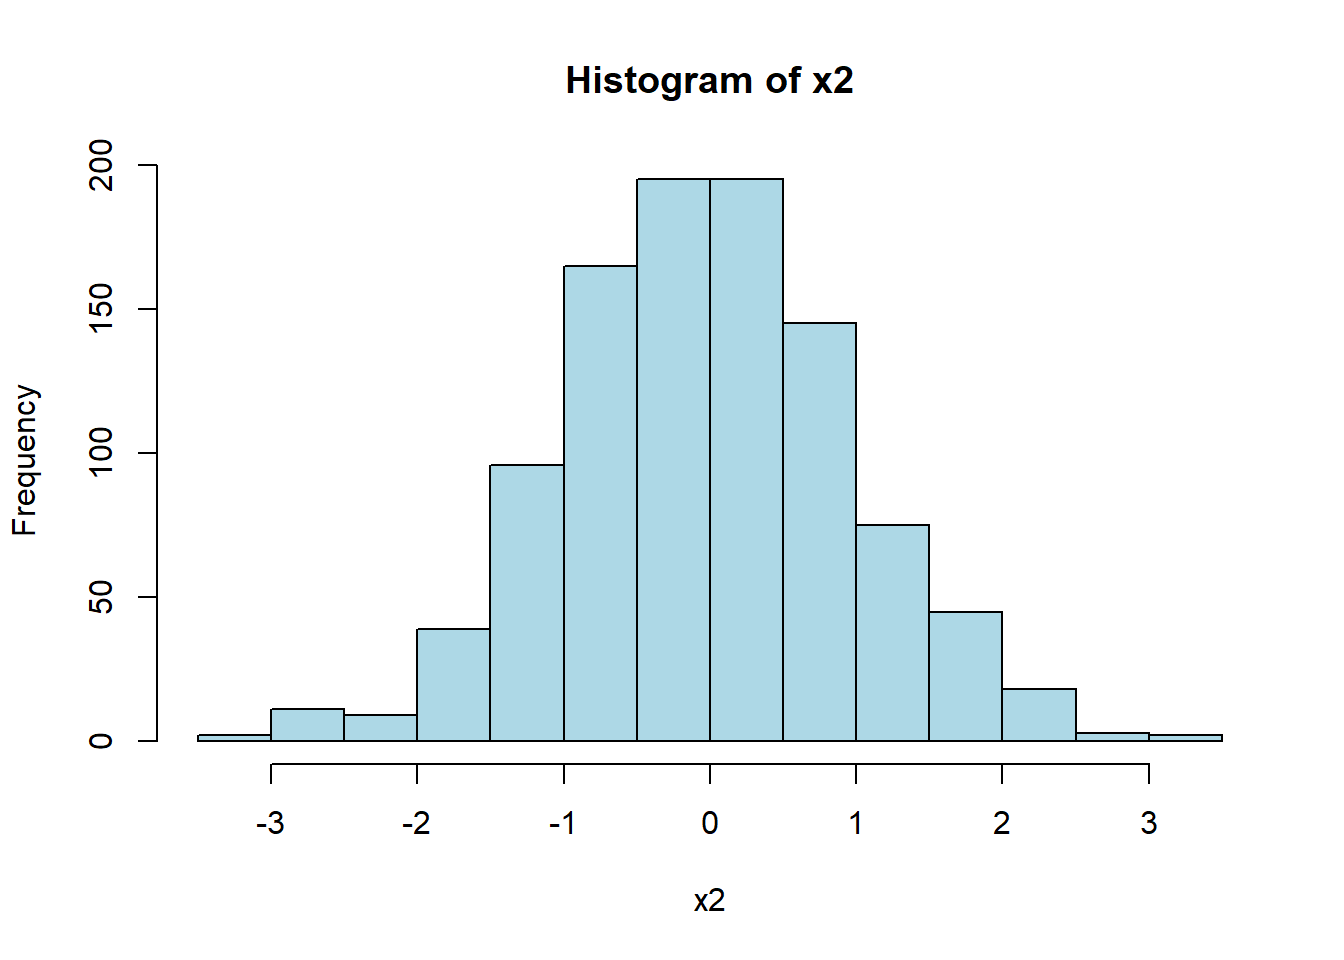
[1] -0.0265972[1] 0.997337759.3 Example 3
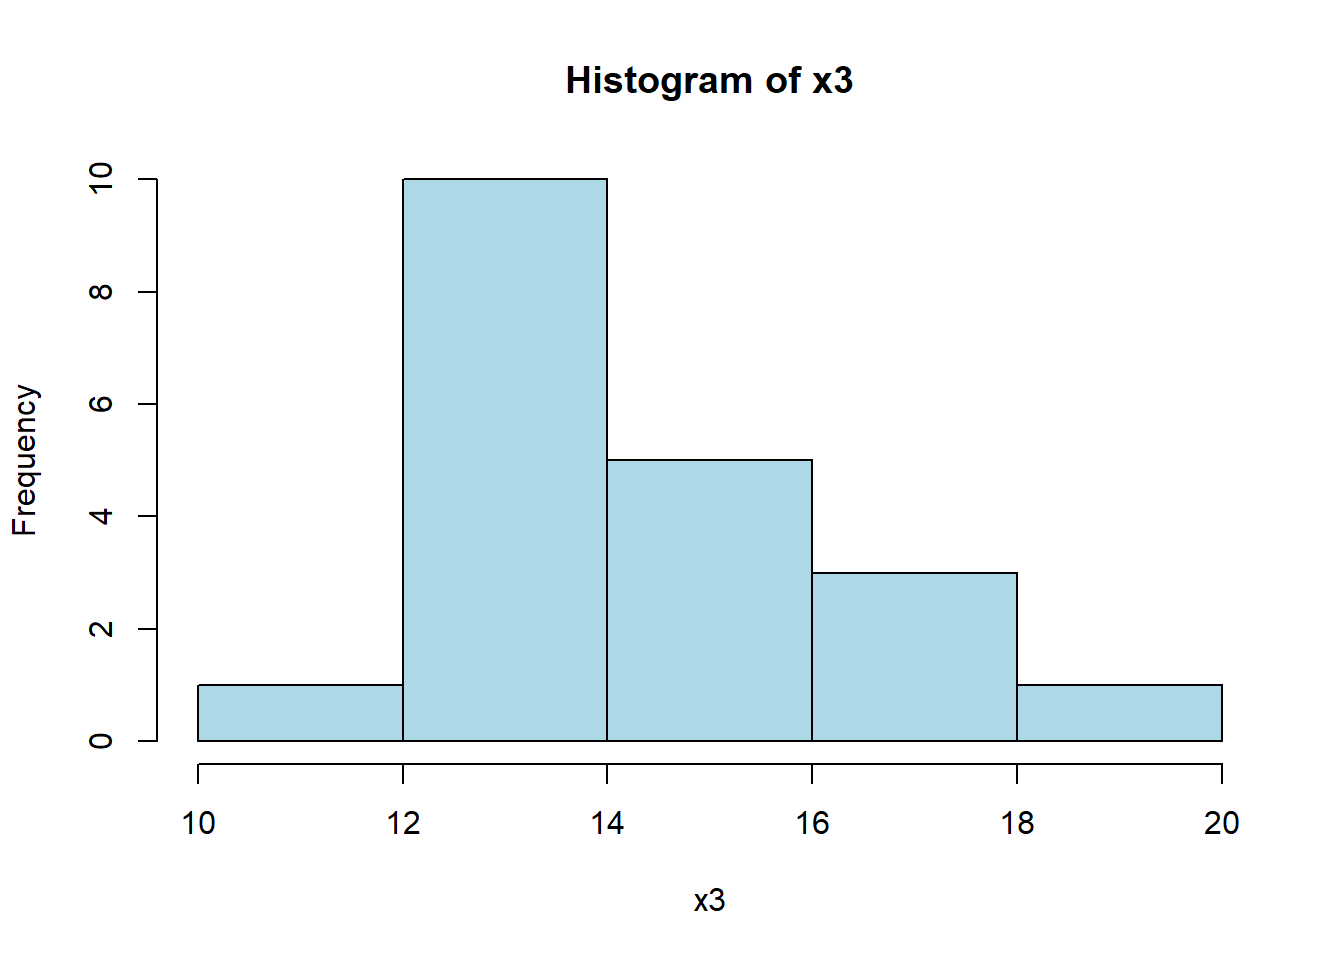
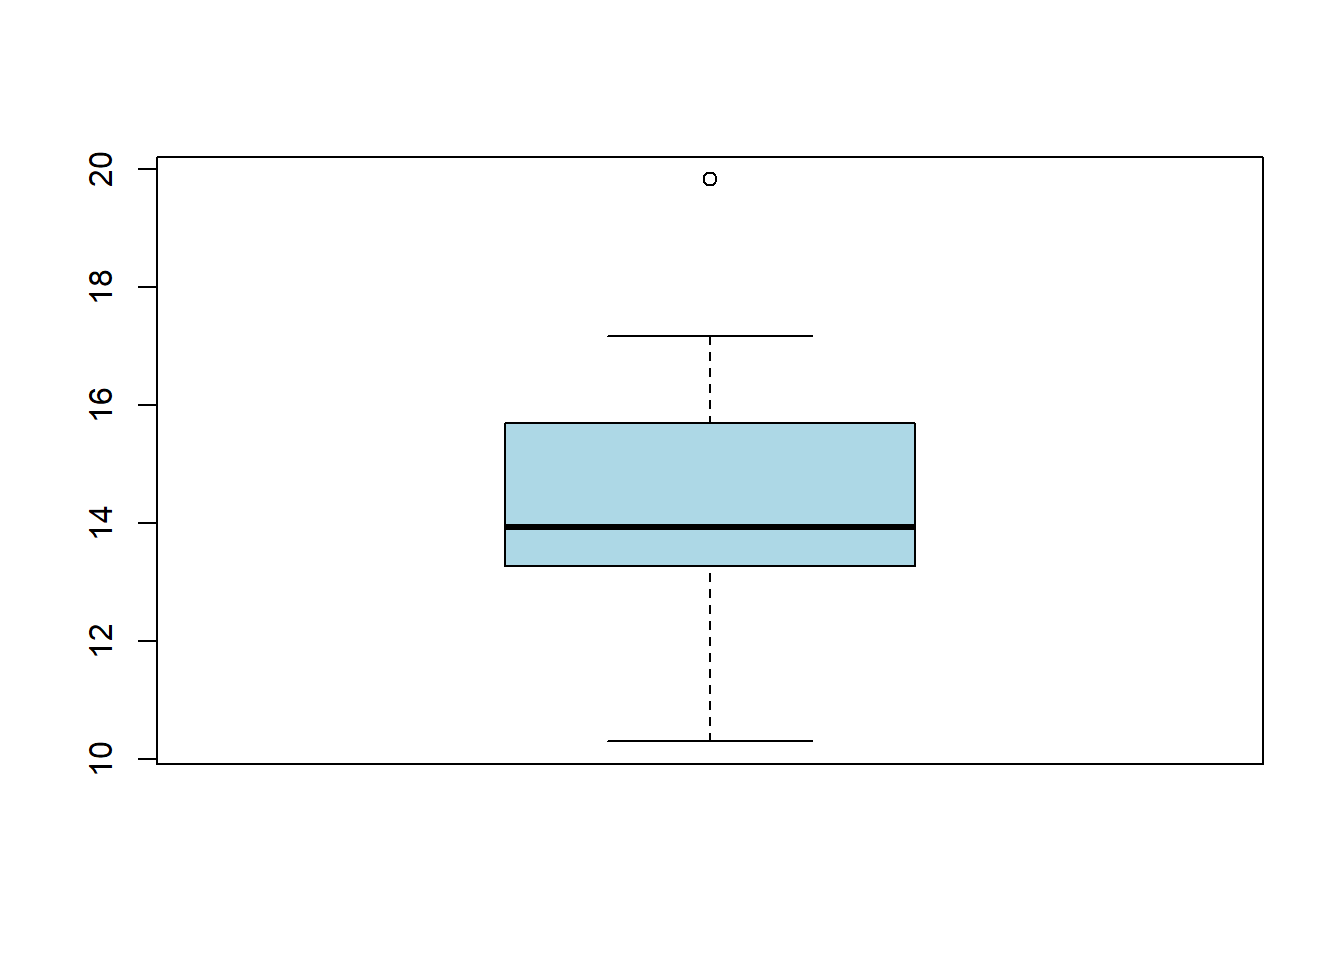
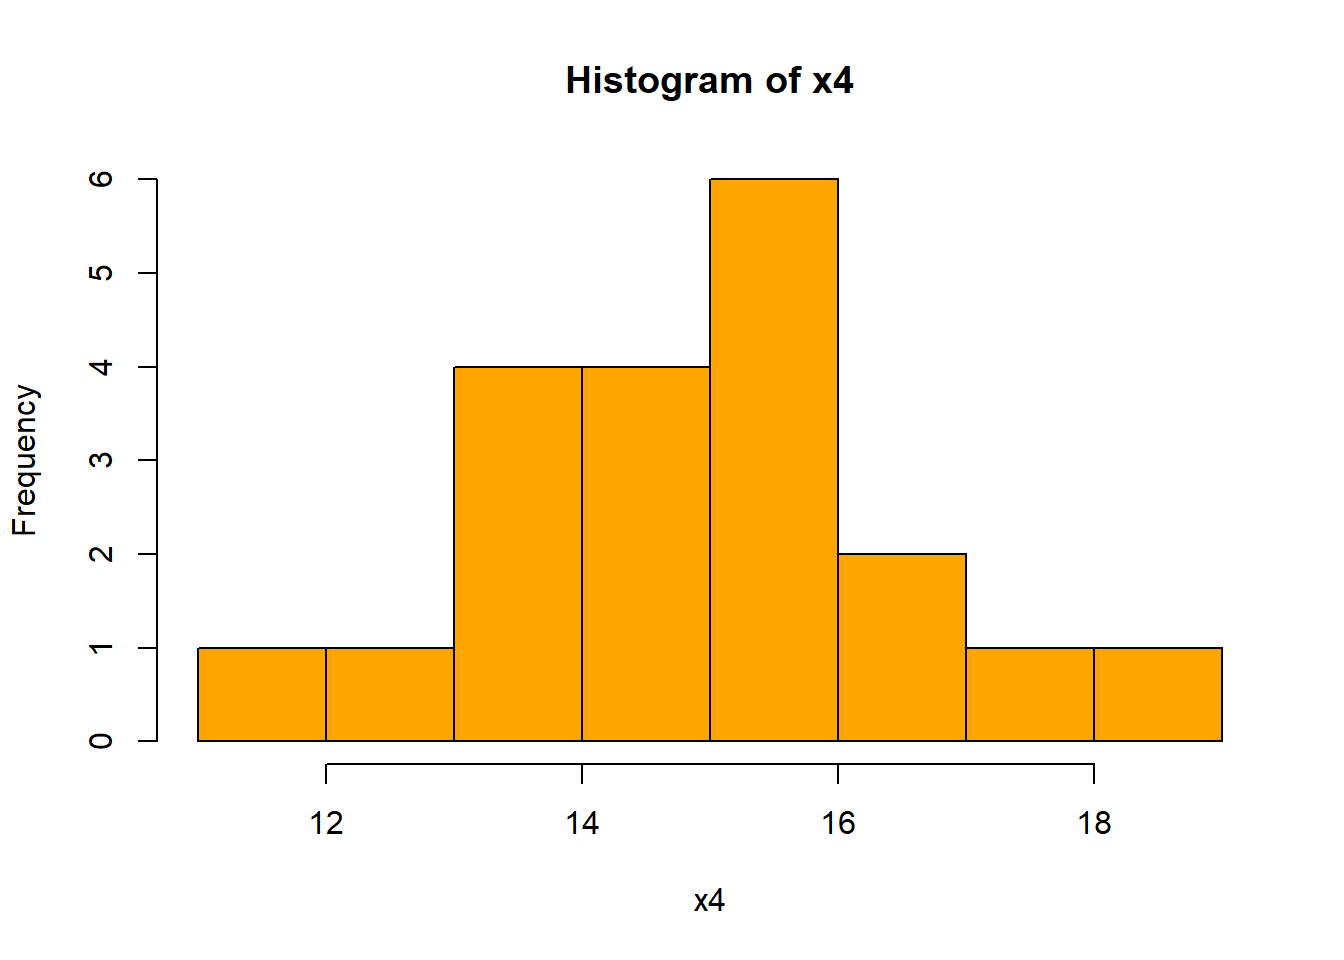
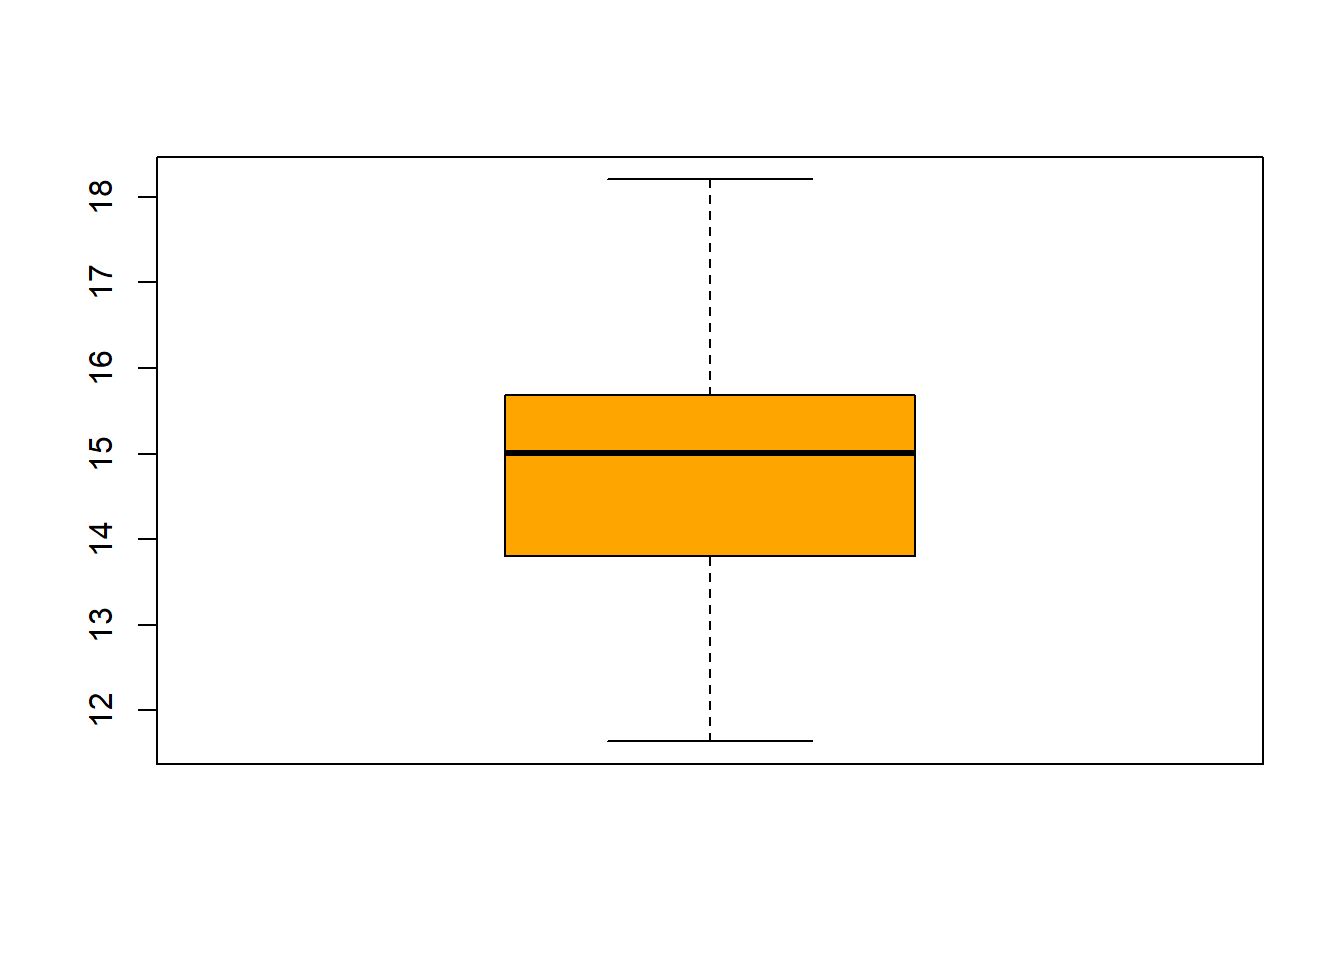
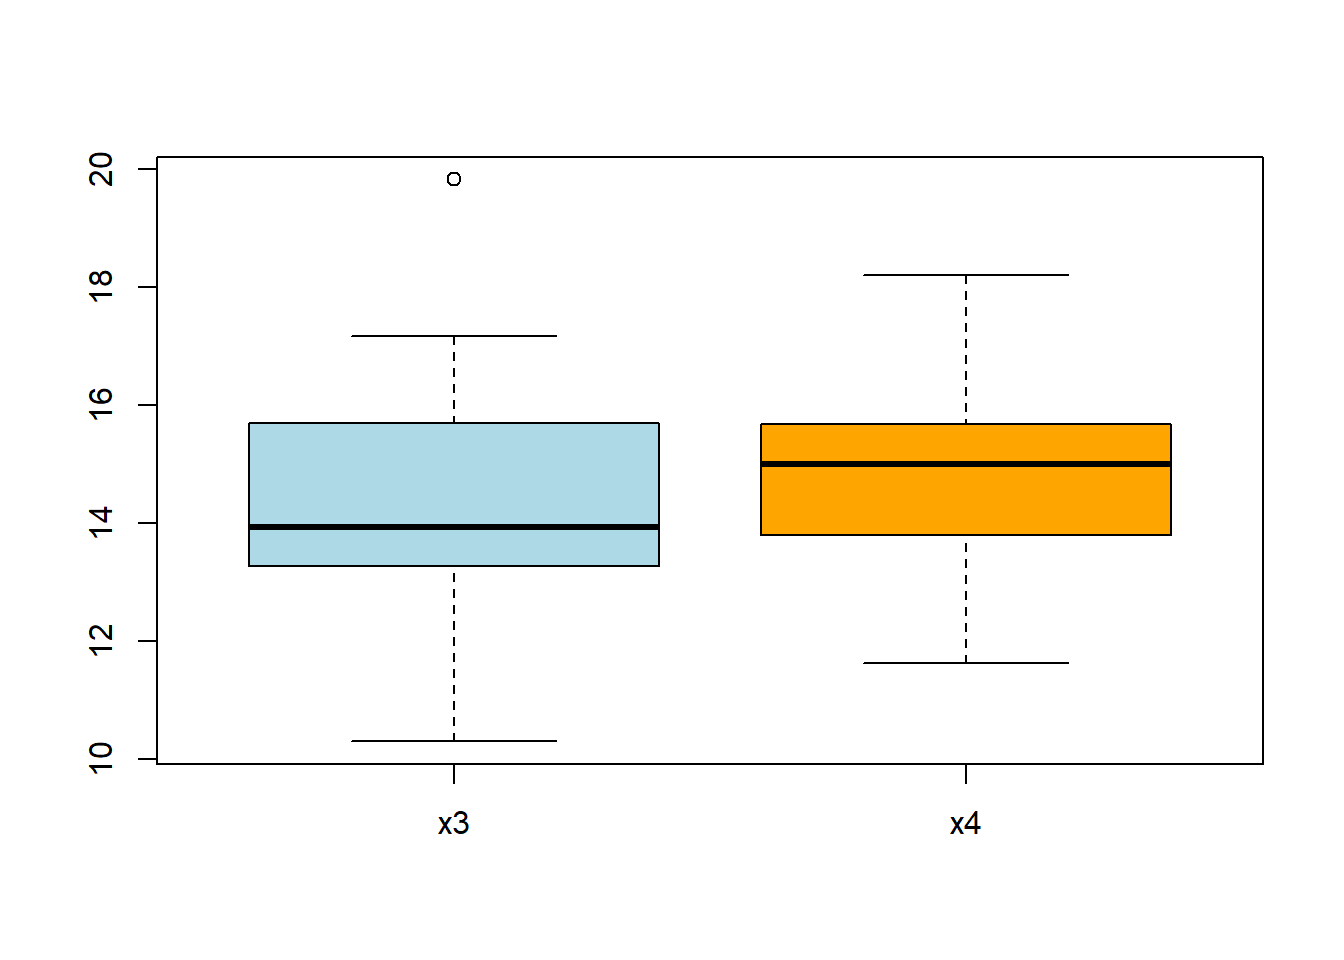
Generate 20 values from a \(N(\mu=15, \sigma=2)\) and 20 values from a\(N(\mu=16, \sigma=2)\).
Compare the two data sets.
Can you tell they come from different distributions?
59.4 Example 4
For a variable with a \(N(\mu=0, \sigma=1)\) distribution:
What is the probability a value will be greater than zero?
What is the probability it will be less than 1.96?
What is the probability it will lie in the range (-1.96,1.96).
If instead the variable has a \(N(\mu=10, \sigma=52)\) distribution, what is the probability a single sample will be in the range (10-1.965, 10+1.965)?
59.5 Example 5
Generally it can be shown that \(Prob(\mu-1.96 \sigma < X < \mu+1.96 \sigma)\) is 0.95 where \(X \sim N(mean=\mu, sd=\sigma)\).
- Confirm this with your own choice of mean value and sd value.
59.6 Example 6
If the heights of adult persons in the UK are approximately normally distributed with mean=1.62m and sd=0.06m, what proportion of the population is:
taller than 1.7m?
smaller than 1.5m?
In a random sample of 100 adult persons how many would you expect to be taller than (a) 1.62m (b) 1.7m?