Section 41 Multiple Variables: Exercise
41.1 Exercise
Prepare appropriate plots to evaluate the relationship between temperature, radiation, humidity and wind speed of the weather data
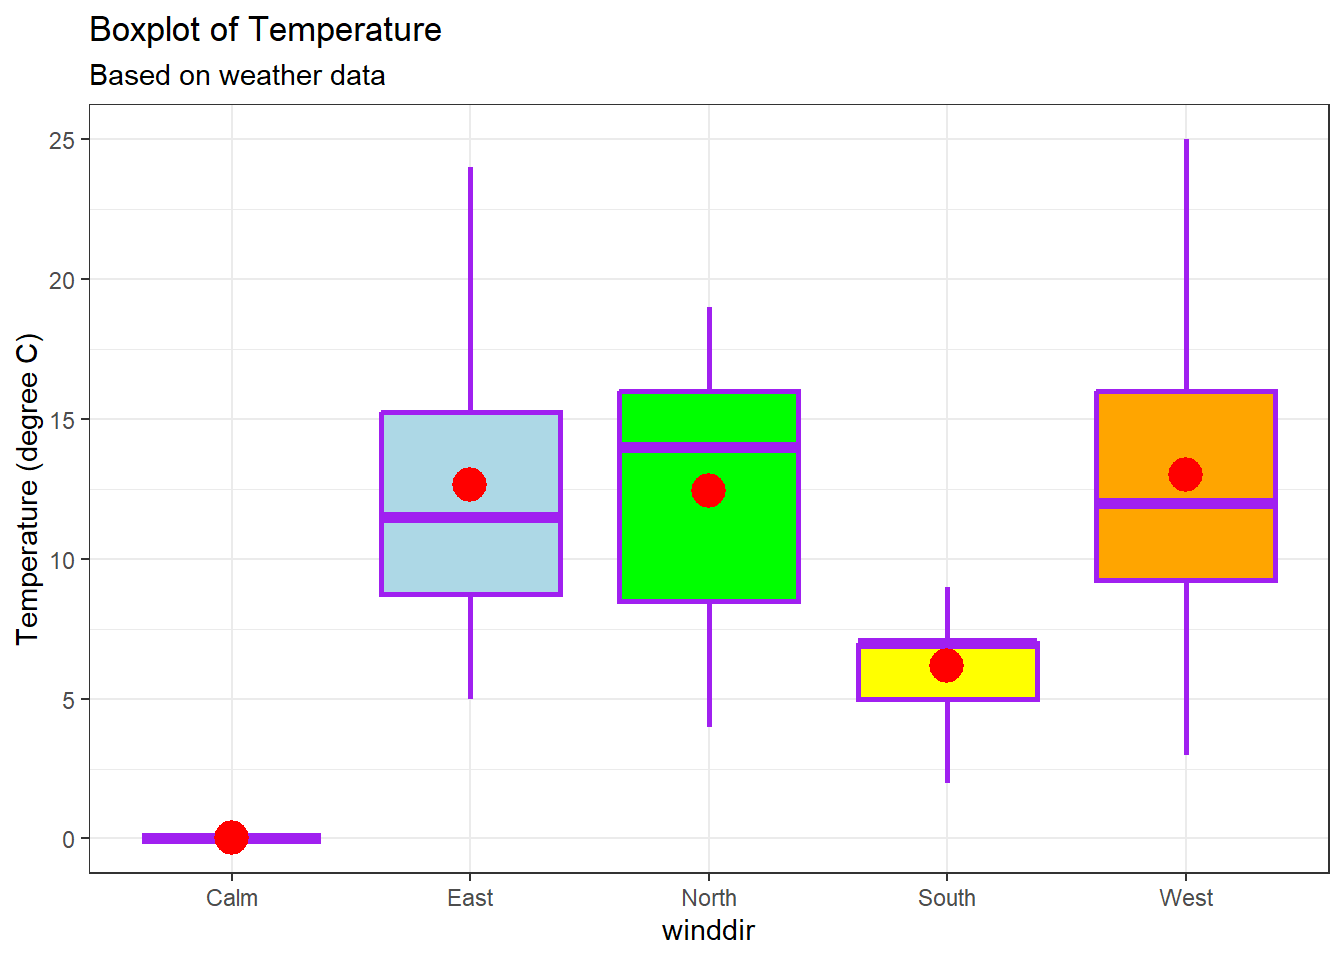
Explore the relationship between wind speed and wind direction of the weather data
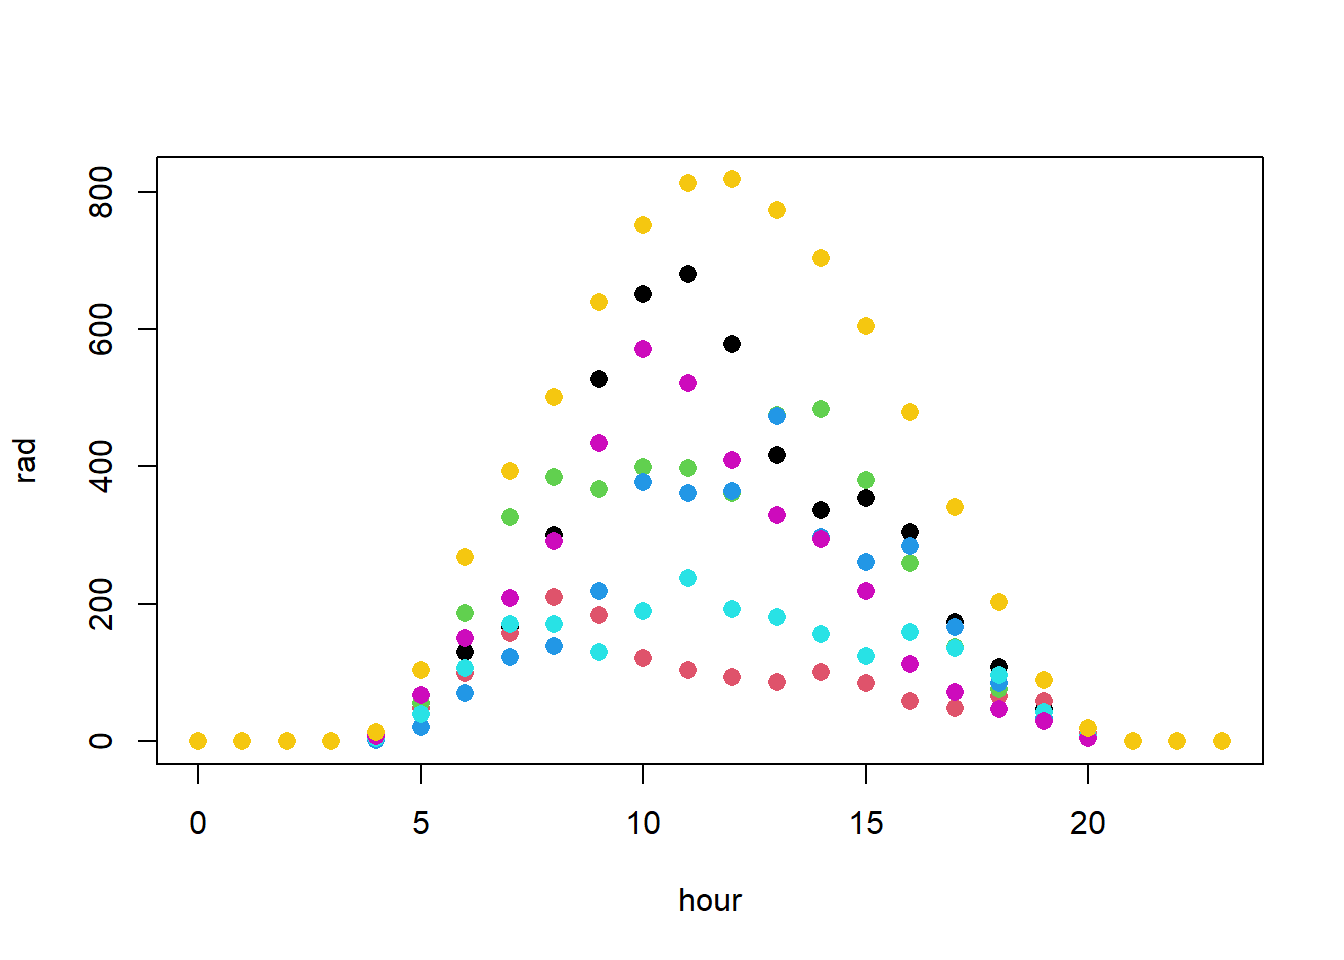
Explore the relationship between radiation and hour of the day for different days
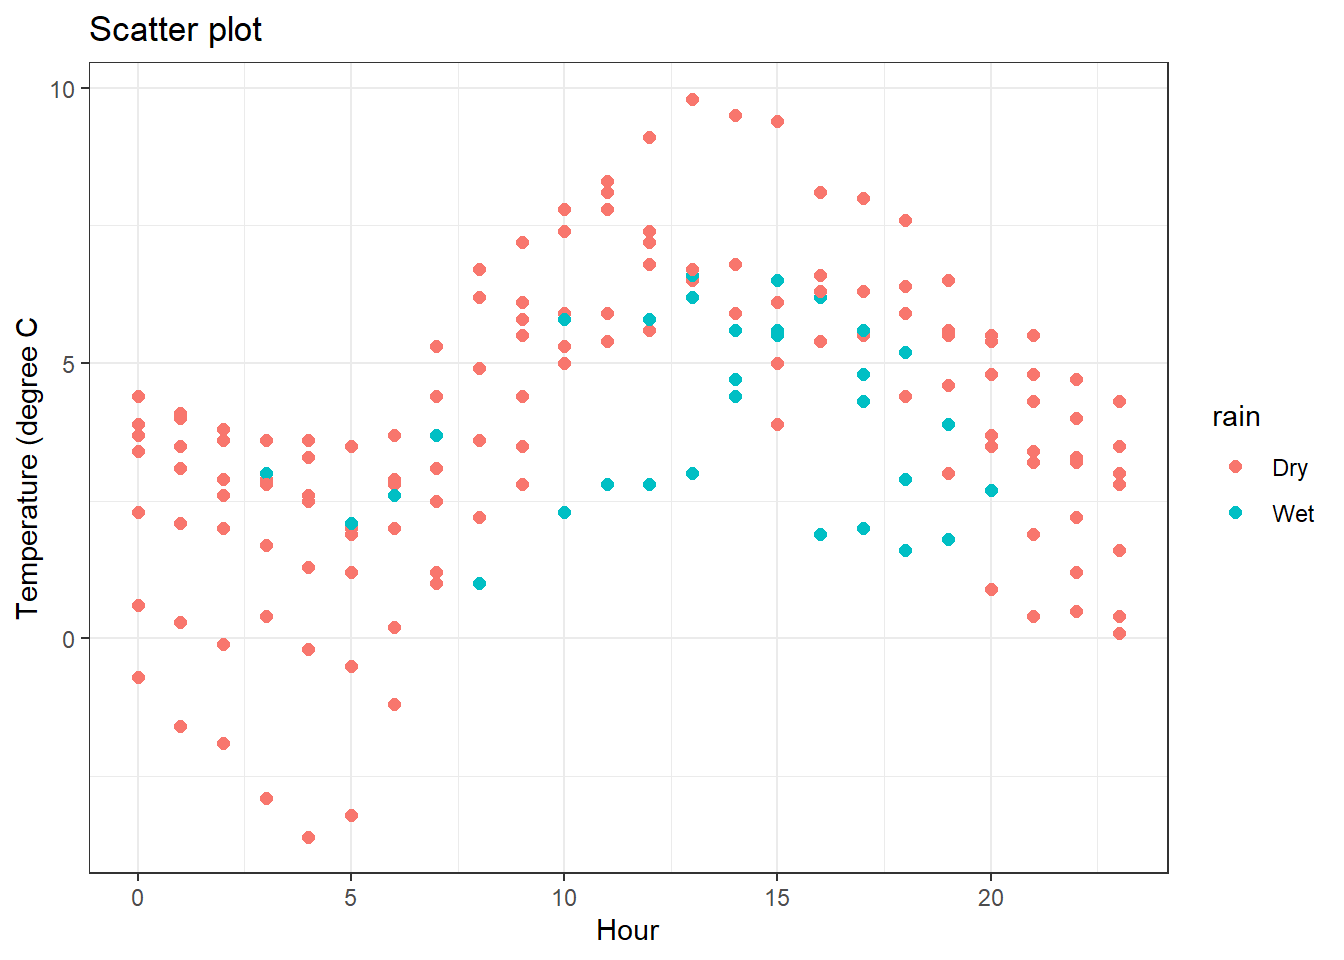
Explore the relationship between temperature and hour of the day for different levels of rain
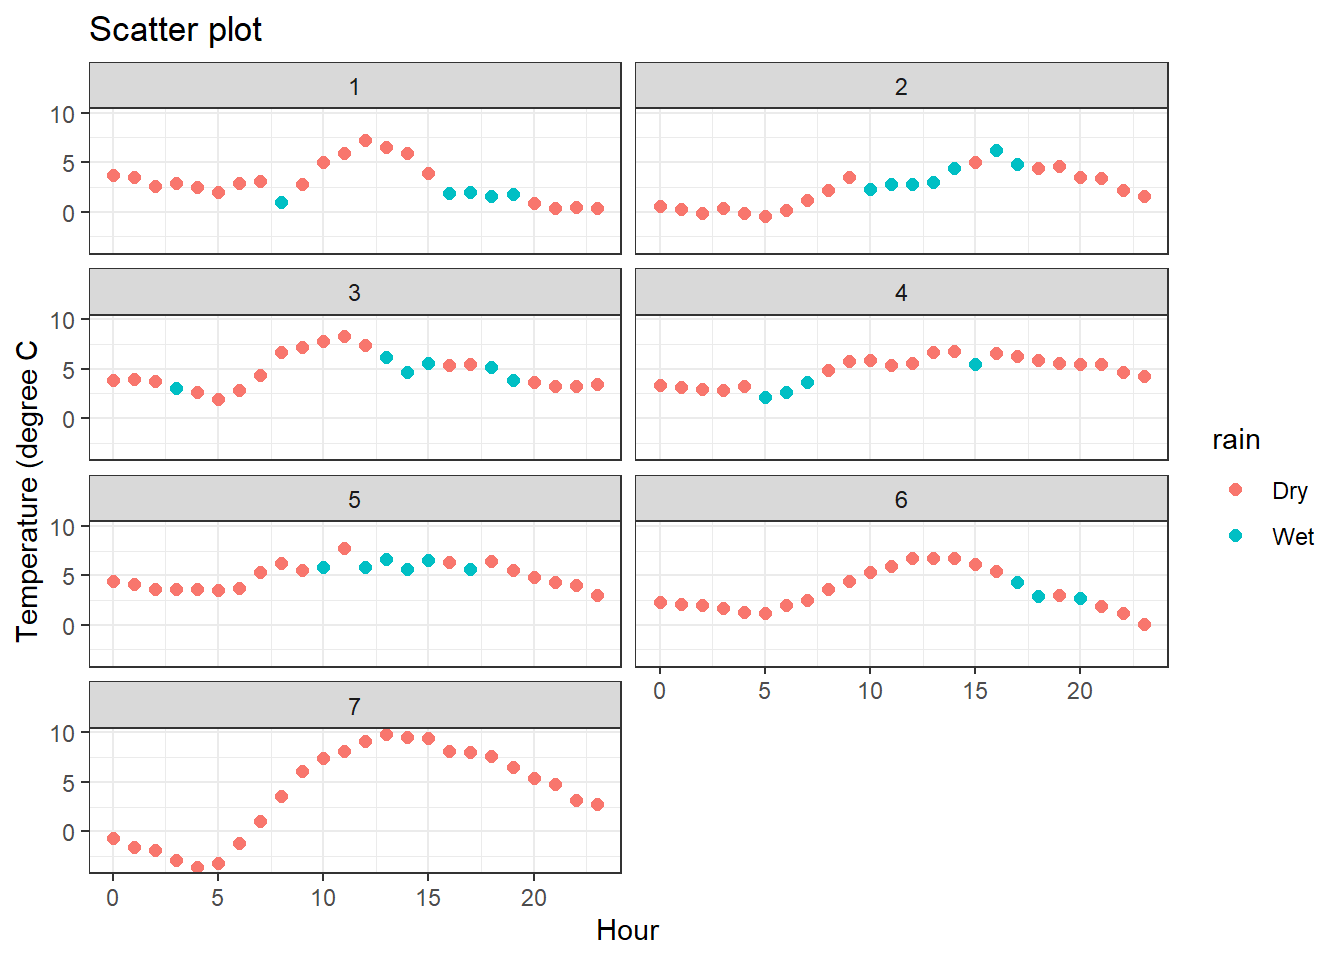
Explore the relationship between temperature and hour of the day for different levels of rain with different panels for different days
'data.frame':   168 obs. of  9 variables:
 $ day     : int  1 1 1 1 1 1 1 1 1 1 ...
 $ hour    : int  0 1 2 3 4 5 6 7 8 9 ...
 $ cloud   : int  1 6 3 4 1 1 4 7 6 6 ...
 $ rad     : int  0 0 0 0 6 56 130 166 300 527 ...
 $ temp    : num  3.7 3.5 2.6 2.9 2.5 2 2.9 3.1 1 2.8 ...
 $ humidity: int  80 78 82 74 68 69 69 76 96 89 ...
 $ rain    : chr  "Dry" "Dry" "Dry" "Dry" ...
 $ windsp  : int  11 11 8 13 15 14 16 16 9 12 ...
 $ winddir : chr  "West" "West" "West" "West" ...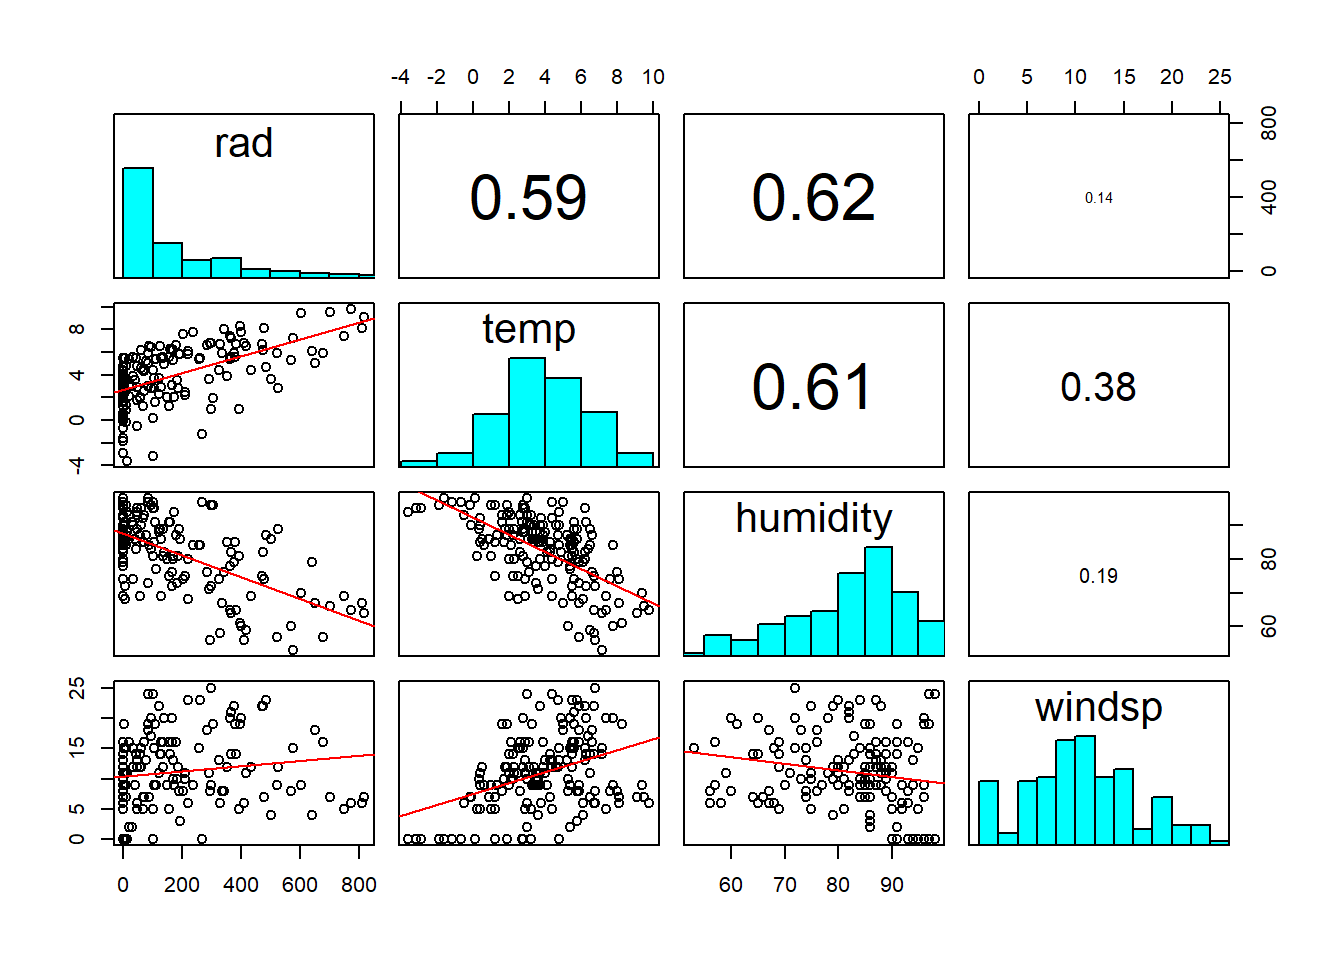
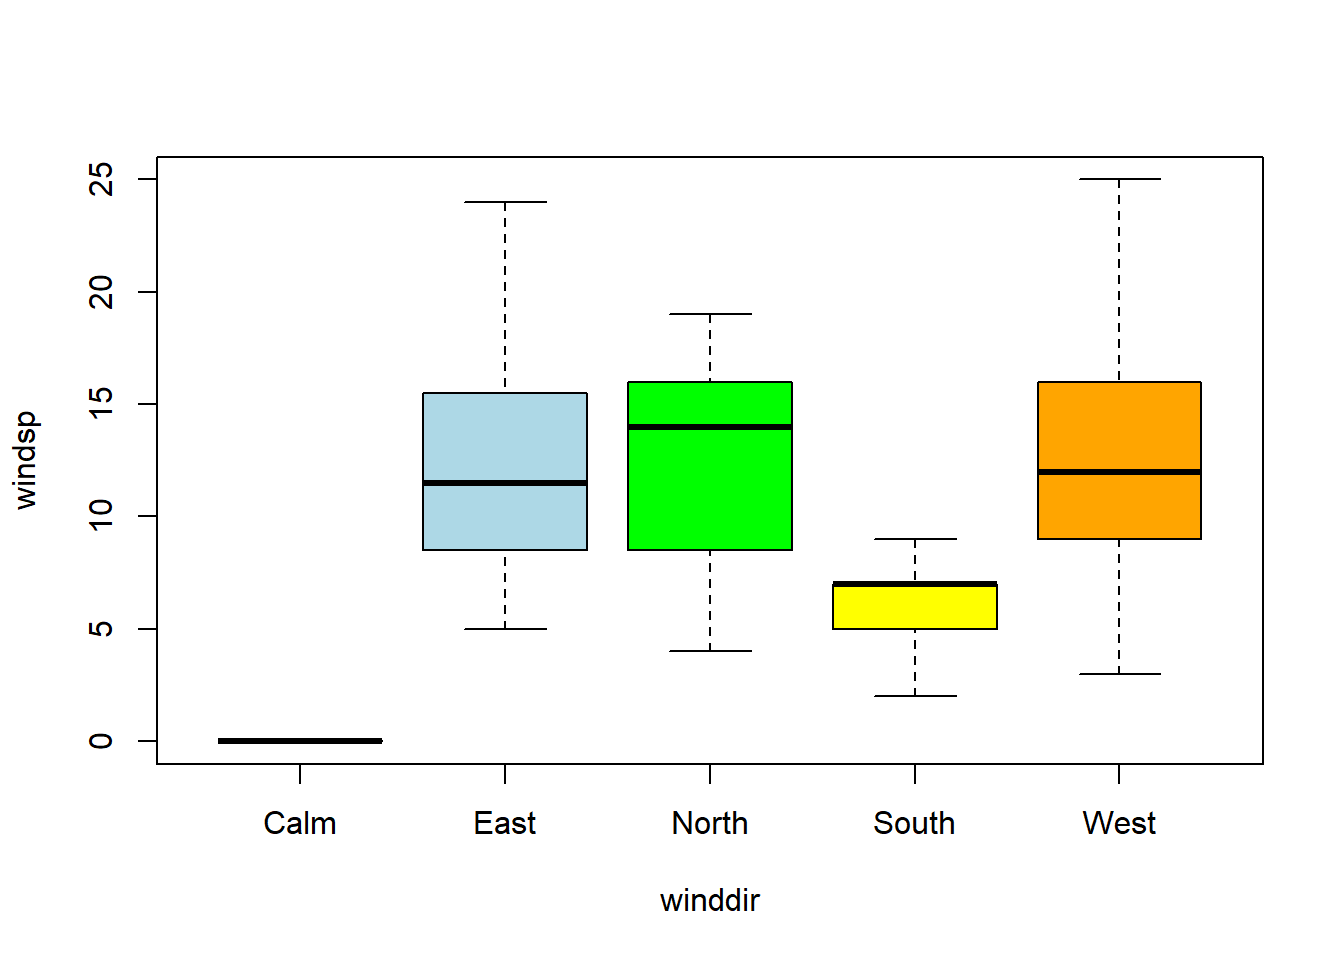
$Calm
   Min. 1st Qu.  Median    Mean 3rd Qu.    Max.
      0       0       0       0       0       0

$East
   Min. 1st Qu.  Median    Mean 3rd Qu.    Max.
   5.00    8.75   11.50   12.65   15.25   24.00

$North
   Min. 1st Qu.  Median    Mean 3rd Qu.    Max.
   4.00    8.50   14.00   12.43   16.00   19.00

$South
   Min. 1st Qu.  Median    Mean 3rd Qu.    Max.
  2.000   5.000   7.000   6.176   7.000   9.000

$West
   Min. 1st Qu.  Median    Mean 3rd Qu.    Max.
   3.00    9.25   12.00   13.01   16.00   25.00