Section 32 Two or More Categorical Variables: Bar Plot
32.1 Bar & Mosaic plot
data(mpg)
# Single factor

g <- ggplot(data=mpg, mapping=aes(x=class, fill=class))
g <- g + geom_bar(position='dodge')
g + theme_bw()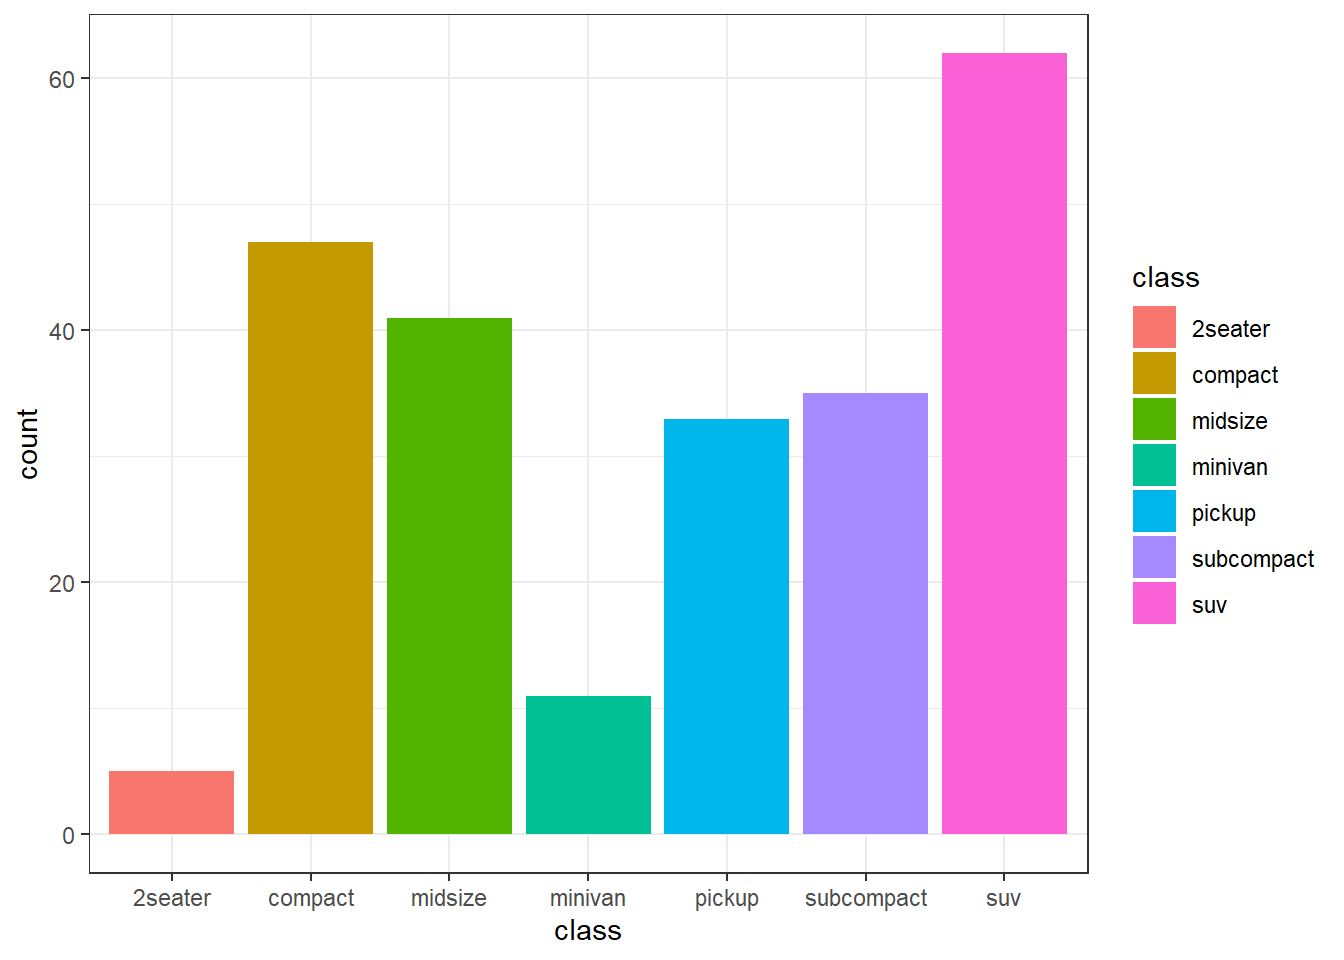
# Two factors
# Mosaic plot using position='dodge'

g <- ggplot(data=mpg, mapping=aes(x=class))
g <- g + geom_bar(position='dodge')
g <- g + geom_bar(aes(fill=drv))
g <- g + labs(title='Mosaic plot')
g + theme_bw()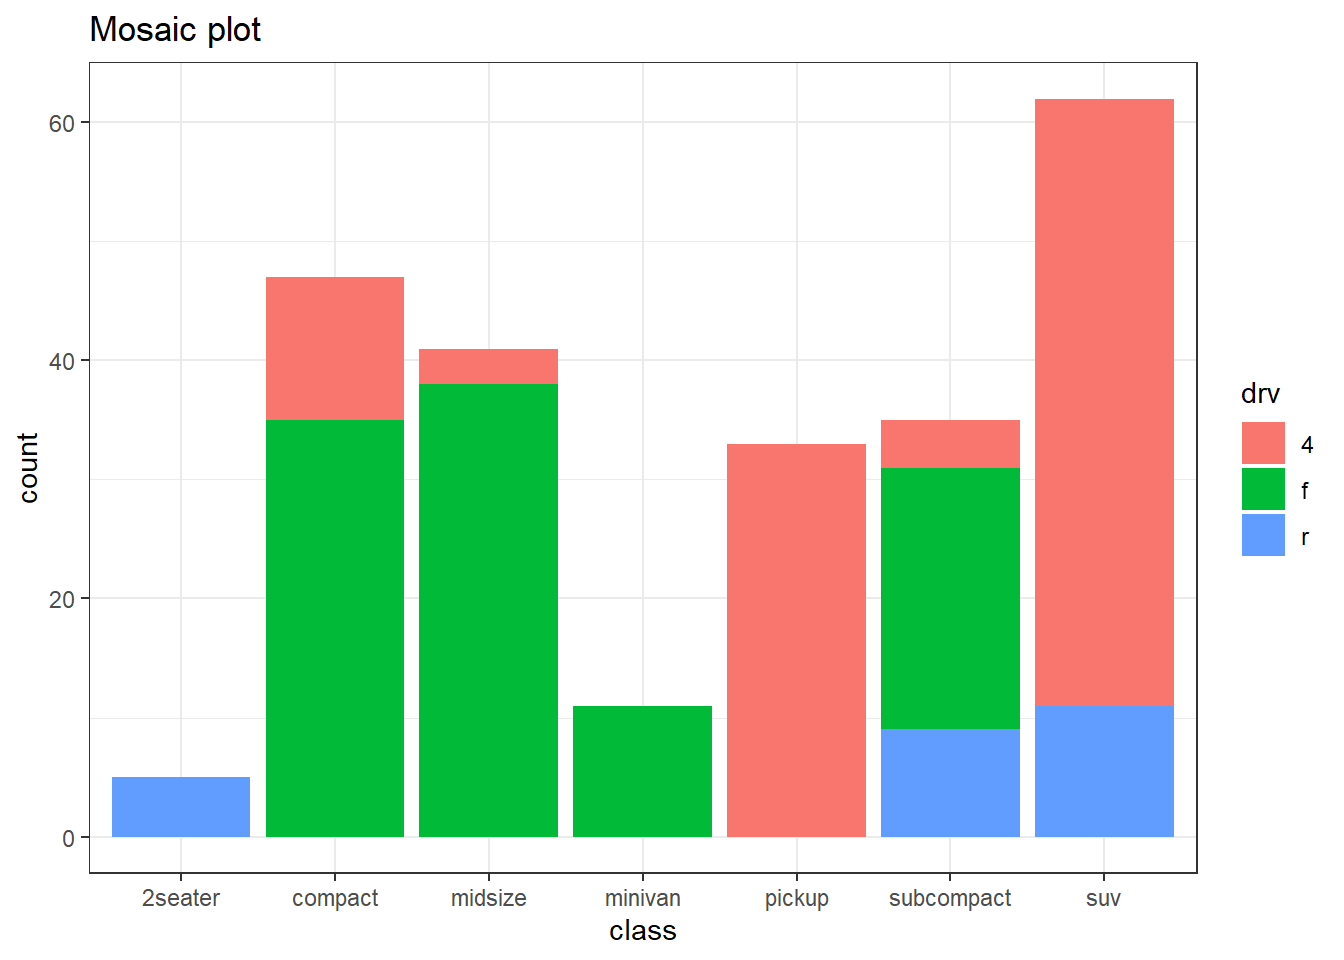
# Two factors
# Mosaic plot using position='stack'

g <- ggplot(data=mpg, mapping=aes(x=class, fill=drv))
g <- g + geom_bar(position='stack')
g <- g + labs(title='Mosaic plot')
g + theme_bw()