Section 22 Single Categorical Variable: Bar plot

22.1 Bar plot

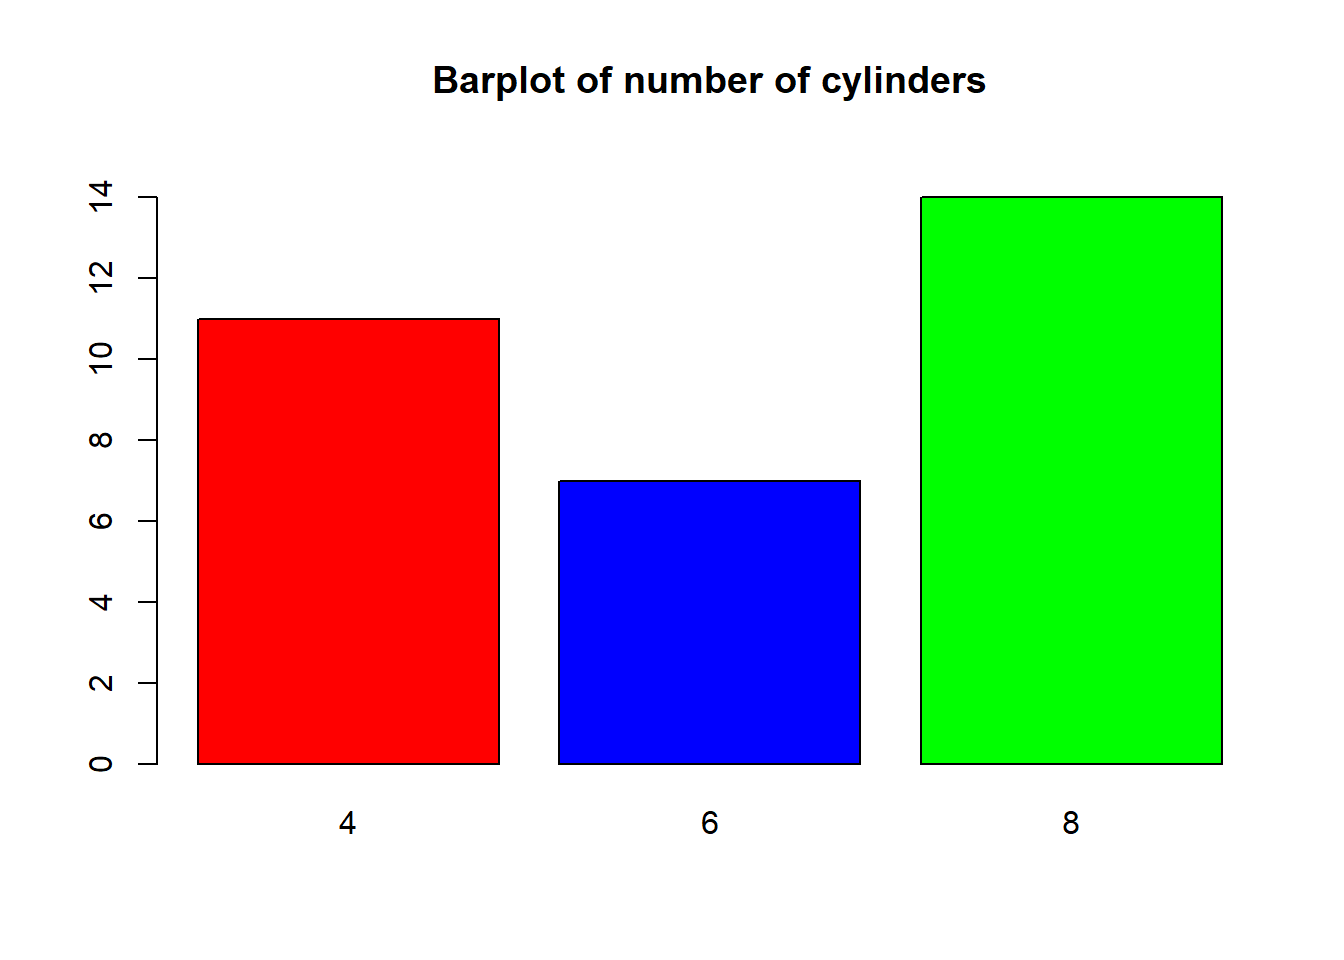
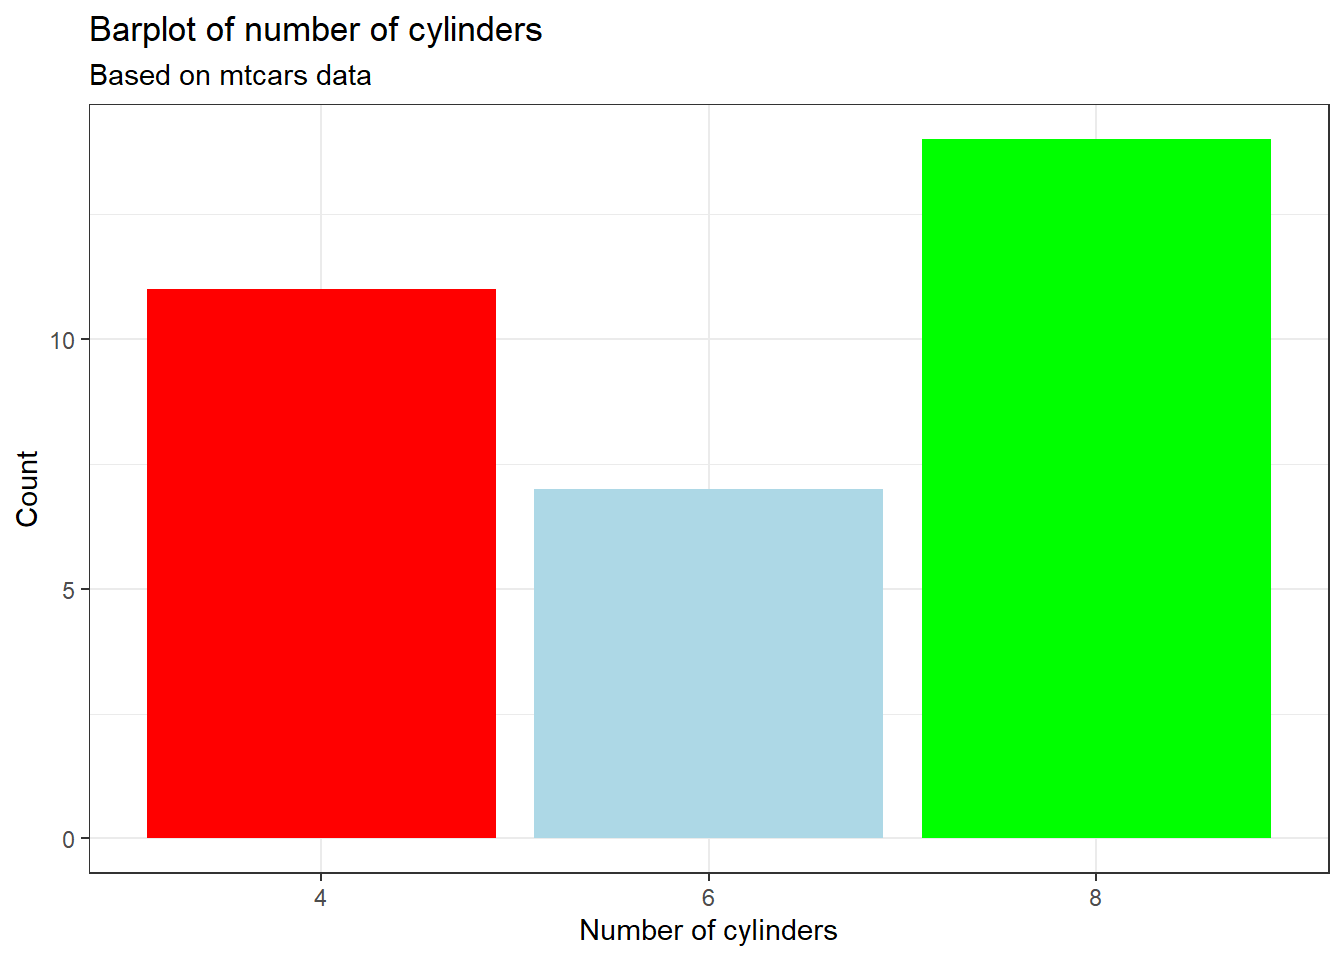
  • Bar plot is used for the categorical variables.

  • It plots the frequencies against each of the level of the categorical variable.

22.2 package base

data(mtcars)

x <- table(mtcars$cyl)

barplot(height = x, 
        ylim = c(0, 15), 
        names.arg = names(x), 
        col = c('red','blue','green'),
        horiz = FALSE,
        main = 'Barplot of number of cylinders')

22.3 package ggplot2

g <- ggplot(data=mtcars, aes(x = factor(cyl)))
g <- g + geom_bar(fill=c('red','lightblue','green'))
g <- g + labs(title='Barplot of number of cylinders',
              subtitle='Based on mtcars data',
              x='Number of cylinders',
              y='Count')
g + theme_bw()