# panel.smooth
panel.smooth <- function (x, y, col = par("col"), bg = NA, pch = par("pch"),
cex = 1, col.smooth = "red", span = 2/3, iter = 3, ...)
{
points(x, y, pch = pch, col = col, bg = bg, cex = cex)
ok <- is.finite(x) & is.finite(y)
if (any(ok))
lines(stats::lowess(x[ok], y[ok], f = span, iter = iter),
col = col.smooth, ...)
}
# panel.regression
panel.regression <- function (x, y, col = par("col"), bg = NA, pch = par("pch"),
cex = 1, col.regres = "red", ...)
{
points(x, y, pch = pch, col = col, bg = bg, cex = cex)
ok <- is.finite(x) & is.finite(y)
if (any(ok))
abline(stats::lm(y[ok] ~ x[ok]), col = col.regres, ...)
}
## put histograms on the diagonal
panel.hist <- function(x, ...)
{
usr <- par("usr"); on.exit(par(usr))
par(usr = c(usr[1:2], 0, 1.5) )
h <- hist(x, plot = FALSE)
breaks <- h$breaks; nB <- length(breaks)
y <- h$counts; y <- y/max(y)
rect(breaks[-nB], 0, breaks[-1], y, col = "cyan", ...)
}
# put (absolute) correlations on the upper panels,
# with size proportional to the correlations.
panel.cor <- function(x, y, digits = 2, prefix = "", cex.cor, ...)
{
usr <- par("usr"); on.exit(par(usr))
par(usr = c(0, 1, 0, 1))
r <- abs(cor(x, y))
txt <- format(c(r, 0.123456789), digits = digits)[1]
txt <- paste0(prefix, txt)
if(missing(cex.cor)) cex.cor <- 0.8/strwidth(txt)
text(0.5, 0.5, txt, cex = cex.cor * r)
}
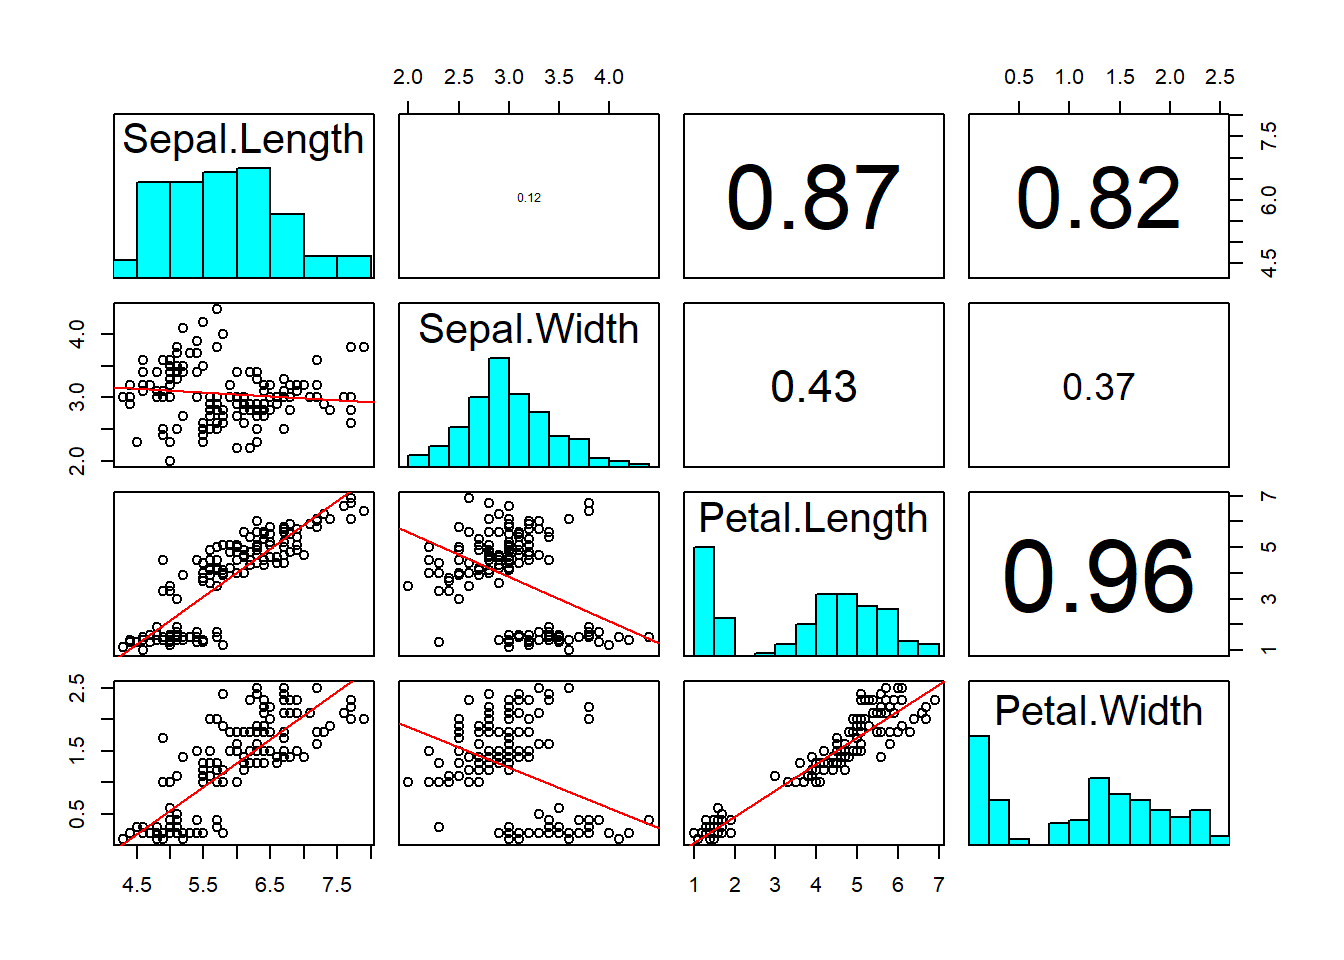
pairs(iris[1:4],
lower.panel = panel.regression,
diag.panel = panel.hist,
upper.panel = panel.cor)