data(mtcars)x <-table(mtcars$cyl)pie(x=x, labels=names(x), col =c('red','blue','green'),main ='Barplot of number of cylinders')
23.3 package ggplot2
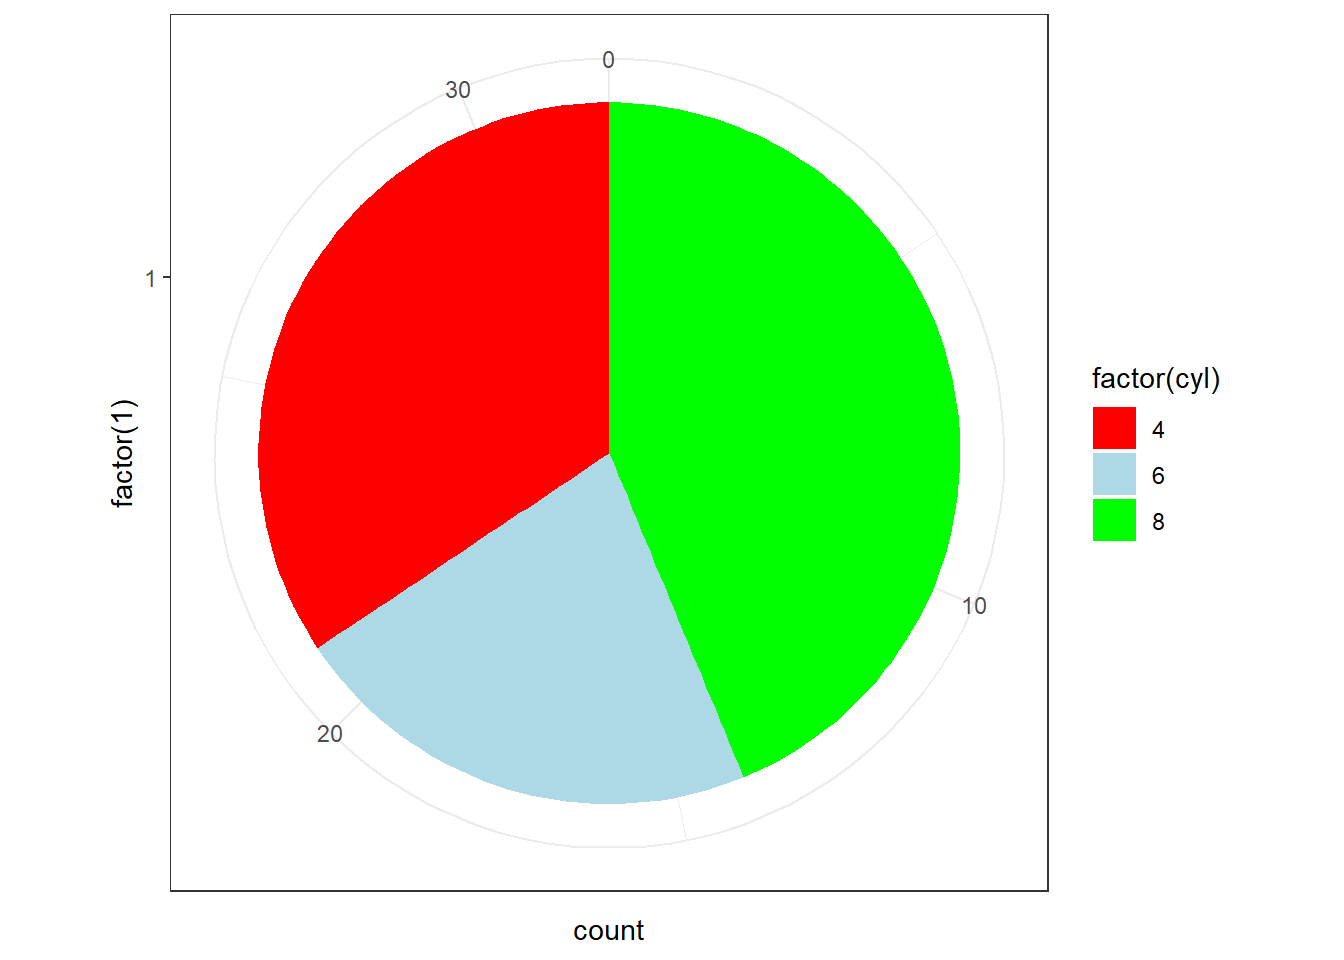
g <-ggplot(data=mtcars, aes(x=factor(1), fill=factor(cyl)))g <- g +geom_bar(width=1)g <- g +coord_polar(theta='y')g <- g +scale_fill_manual(values=c('red','lightblue','green'))g +theme_bw()