Section 29 Two Continuous Variables: Scatter Plot
29.1 Scatter & Rug Plot
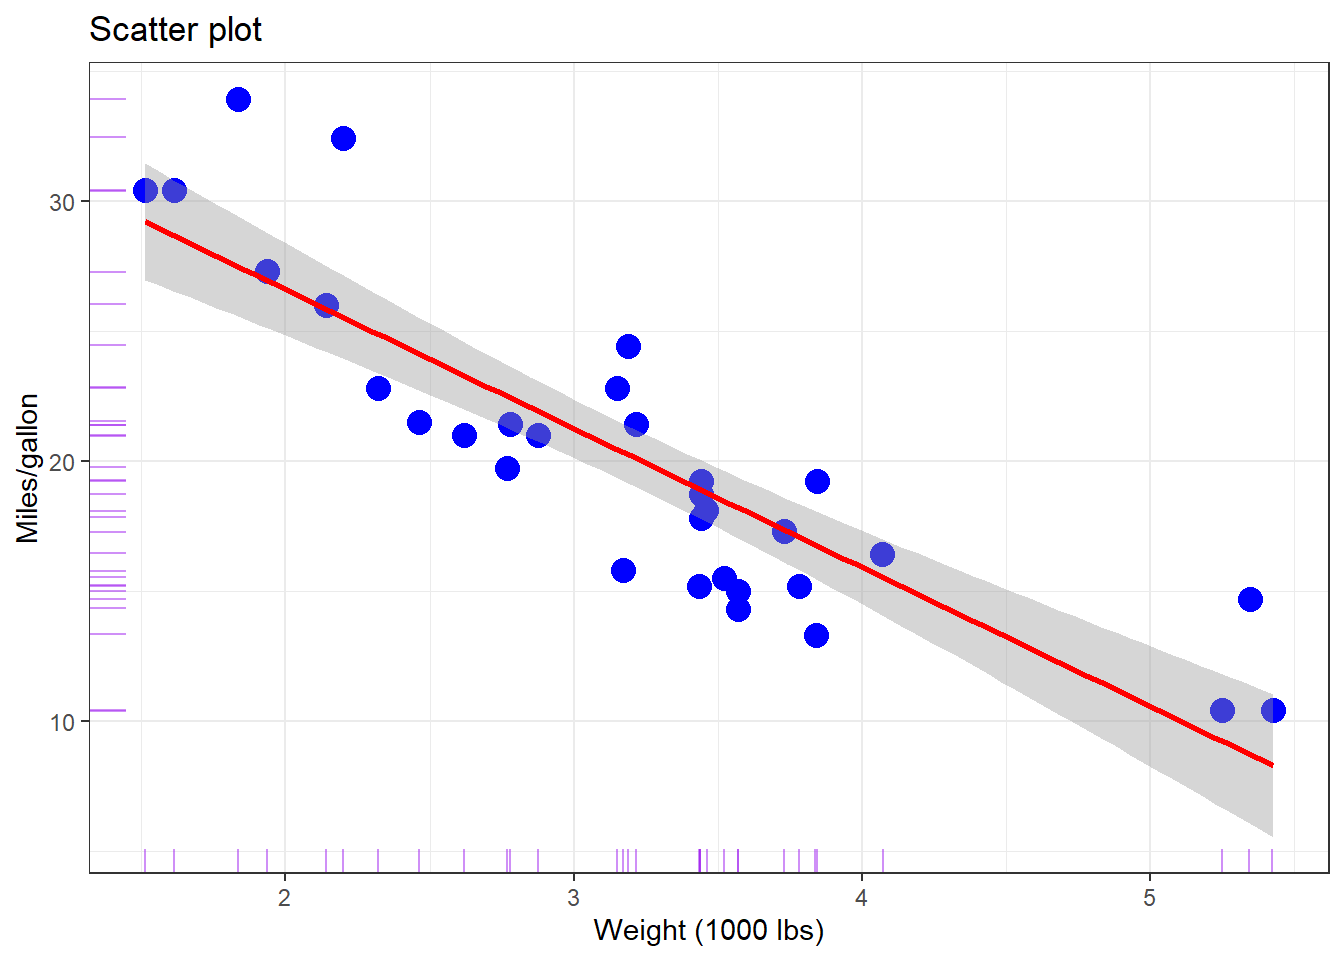
data(mtcars)

g <- ggplot(data=mtcars, mapping=aes(x=wt, y=mpg))
g <- g + geom_point(colour='blue', size=4)
g <- g + geom_smooth(method=lm, se=TRUE, colour='red')
g <- g + geom_rug(alpha=0.50, position='jitter', colour='purple')
g <- g + labs(title='Scatter plot',
              x='Weight (1000 lbs)',
              y='Miles/gallon')
g + theme_bw()