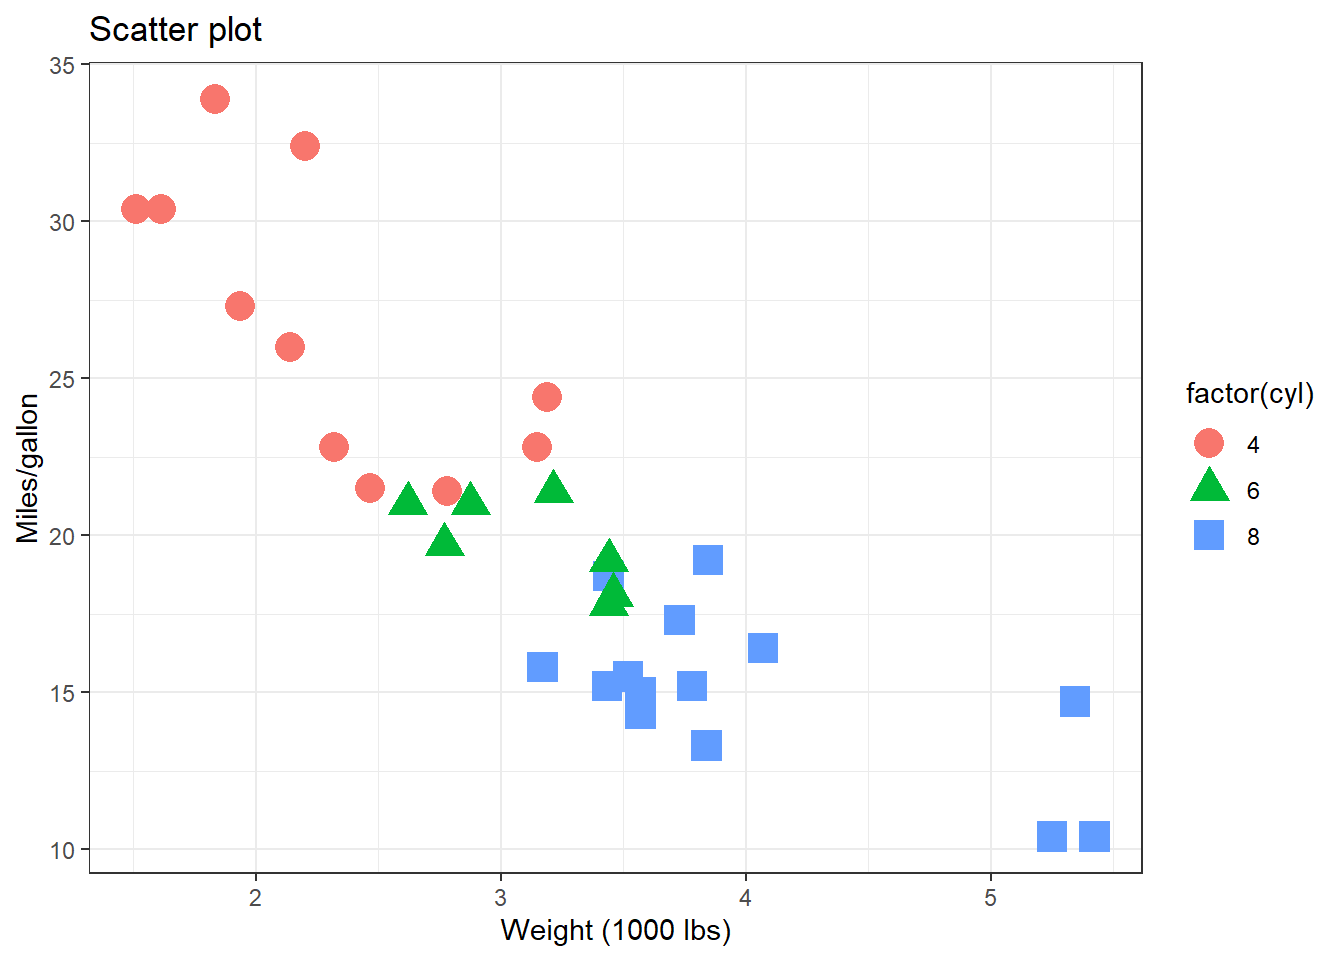
data(mtcars)g <-ggplot(data=mtcars, mapping=aes(x=wt, y=mpg))g <- g +geom_point(mapping=aes(colour=factor(cyl), shape=factor(cyl)), size=5)g <- g +labs(title='Scatter plot',x='Weight (1000 lbs)',y='Miles/gallon')g +theme_bw()
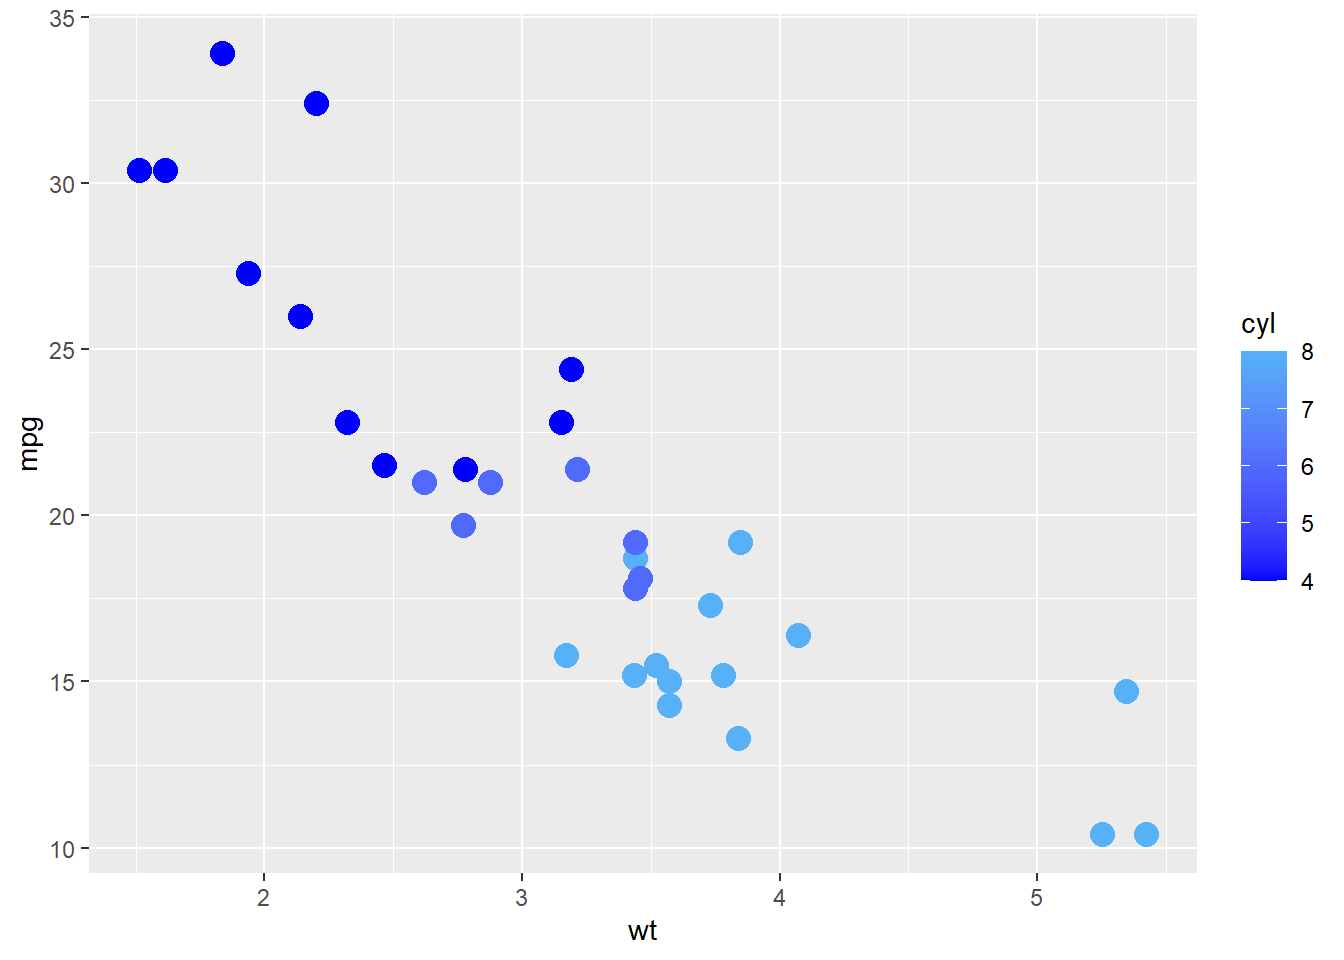
37.2 Numeric, Numeric, Numeric
data(mtcars)g <-ggplot(data=mtcars, mapping=aes(x=wt, y=mpg))g <- g +geom_point(mapping=aes(colour=cyl), size=4) g <- g +scale_colour_gradient(low ='blue')g