Section 38 Multiple Plot Layout in base graphics
- R multiple plots in a specified panel can be defined by:
par(mfrow), par(mfcol): Set a grid layout of fixed sizelayout: Set a grid layout of specified sizessplit.screen: Split a graphics device into multiple screens
- Note: Many high level plot funtion allows
add = TRUEto add or superpose new layers
38.1 par(mfrow)
- Plots of
Sepal.Lengthofirisdata in four panels: - Histogram - Density plot - Box plot - QQ plot
par(mfrow=c(2,2))
x <- iris[,1]
hist(x, col='cyan')
plot(density(x), col='red')
boxplot(x, col='lightblue', border='red')
qqnorm(x, col='blue'); qqline(x, col='red')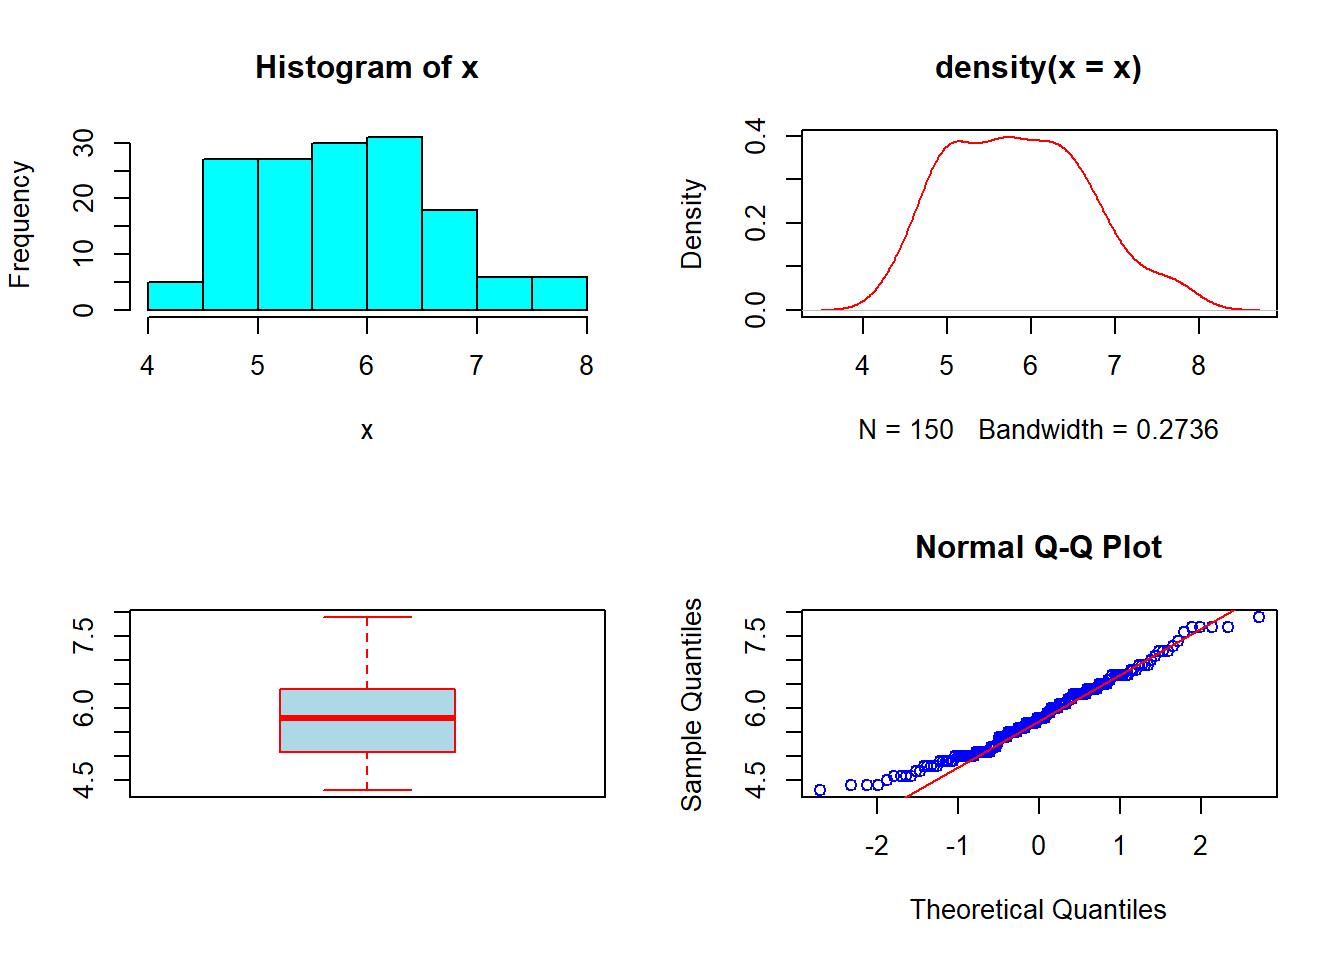
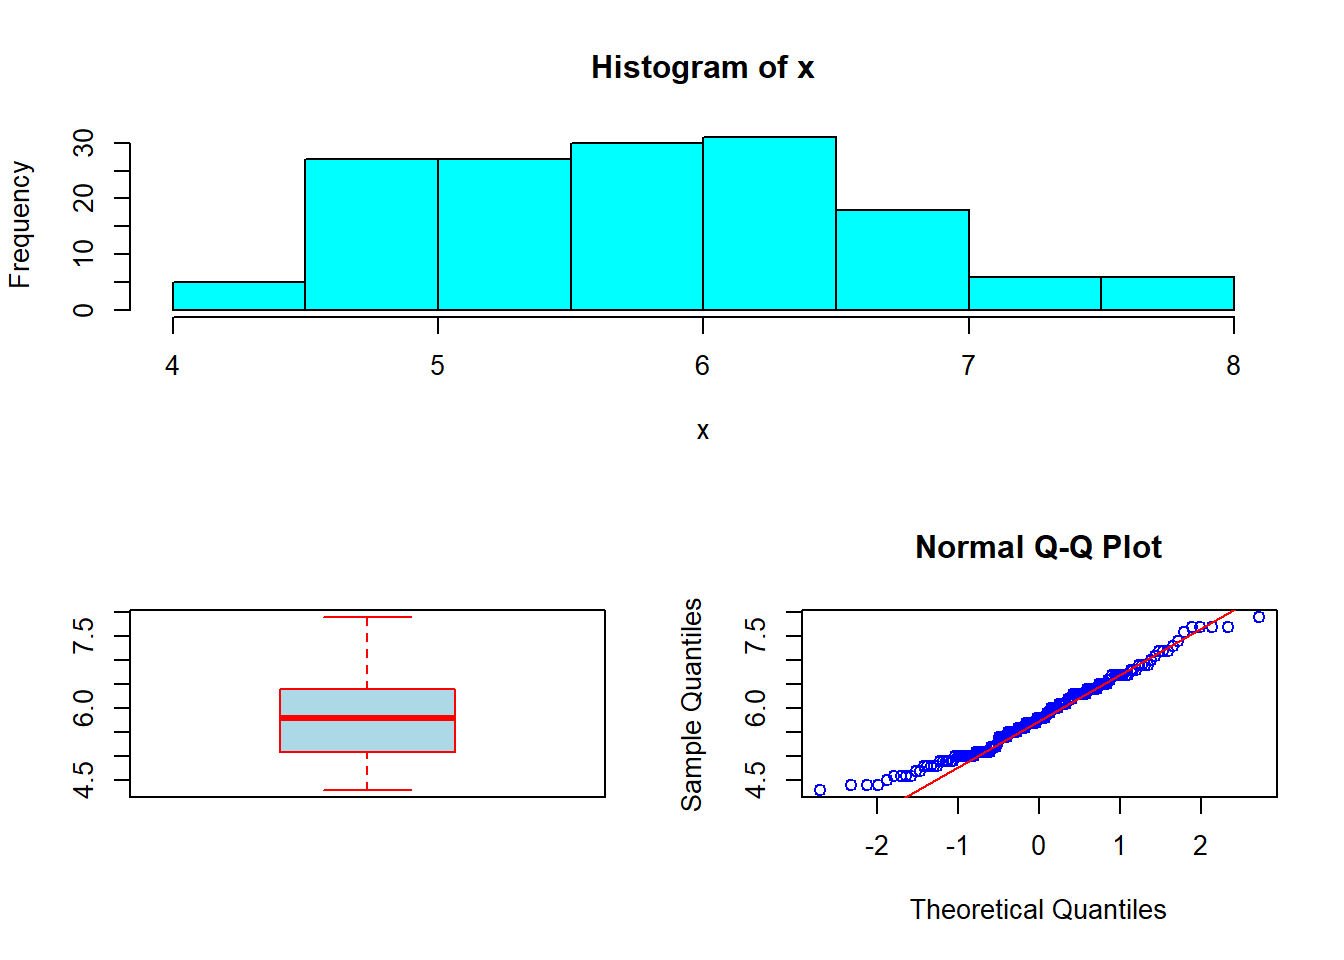
38.2 layout
The function layout divides the device up into as many rows and columns as there are in matrix mat, with the column-widths and the row-heights specified in the respective arguments.
?layout
- Divide the device into two rows and two columns
- Allocate the plot 1 all of row 1
- Allocate plots 2 & 3 in the intersection of (row 2, column 1) and (row 2, column 2)
layout(matrix(c(1,1,2,3), nrow = 2, ncol = 2, byrow = TRUE))

# show the regions that have been allocated to each plot
# layout.show(3)

x <- iris[,1]

hist(x, col='cyan')
boxplot(x, col='lightblue', border='red')
qqnorm(x, col='blue'); qqline(x, col='red')