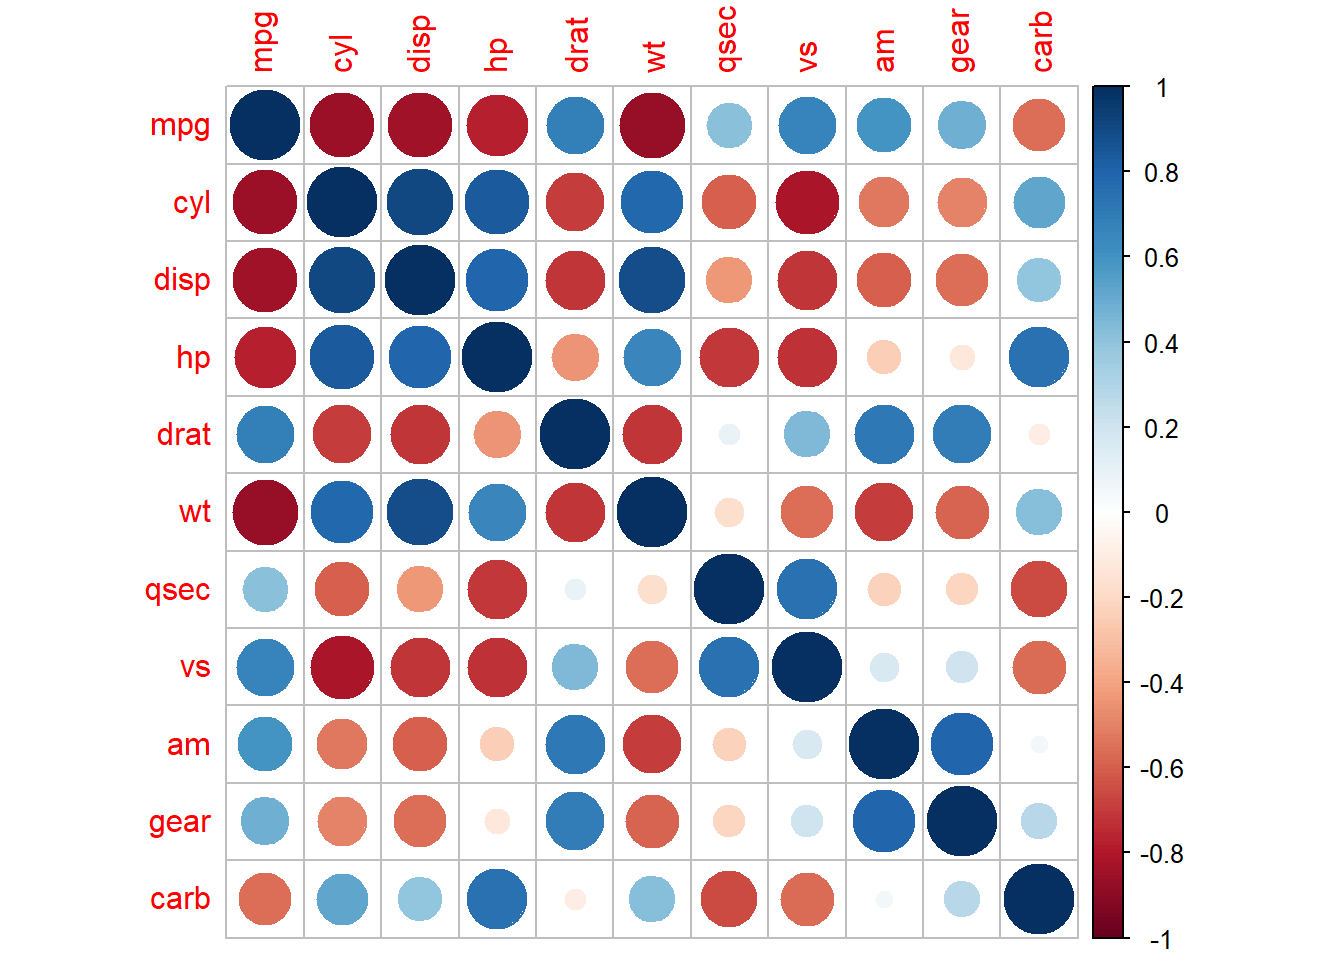
Section 28 Correlogram
Correlogram is the visualisation of the correlation matrix
The R package
corrplotmakes nice visualisation of the correlation matrix
?corrplot
'data.frame':   32 obs. of  11 variables:
 $ mpg : num  21 21 22.8 21.4 18.7 18.1 14.3 24.4 22.8 19.2 ...
 $ cyl : num  6 6 4 6 8 6 8 4 4 6 ...
 $ disp: num  160 160 108 258 360 ...
 $ hp  : num  110 110 93 110 175 105 245 62 95 123 ...
 $ drat: num  3.9 3.9 3.85 3.08 3.15 2.76 3.21 3.69 3.92 3.92 ...
 $ wt  : num  2.62 2.88 2.32 3.21 3.44 ...
 $ qsec: num  16.5 17 18.6 19.4 17 ...
 $ vs  : num  0 0 1 1 0 1 0 1 1 1 ...
 $ am  : num  1 1 1 0 0 0 0 0 0 0 ...
 $ gear: num  4 4 4 3 3 3 3 4 4 4 ...
$ carb: num 4 4 1 1 2 1 4 2 2 4 ... mpg cyl disp hp drat wt qsec vs am gear carb
Mazda RX4 21.0 6 160 110 3.90 2.620 16.46 0 1 4 4
Mazda RX4 Wag 21.0 6 160 110 3.90 2.875 17.02 0 1 4 4
Datsun 710 22.8 4 108 93 3.85 2.320 18.61 1 1 4 1
Hornet 4 Drive 21.4 6 258 110 3.08 3.215 19.44 1 0 3 1
Hornet Sportabout 18.7 8 360 175 3.15 3.440 17.02 0 0 3 2
Valiant 18.1 6 225 105 2.76 3.460 20.22 1 0 3 1 mpg cyl disp hp drat wt qsec vs am gear carb
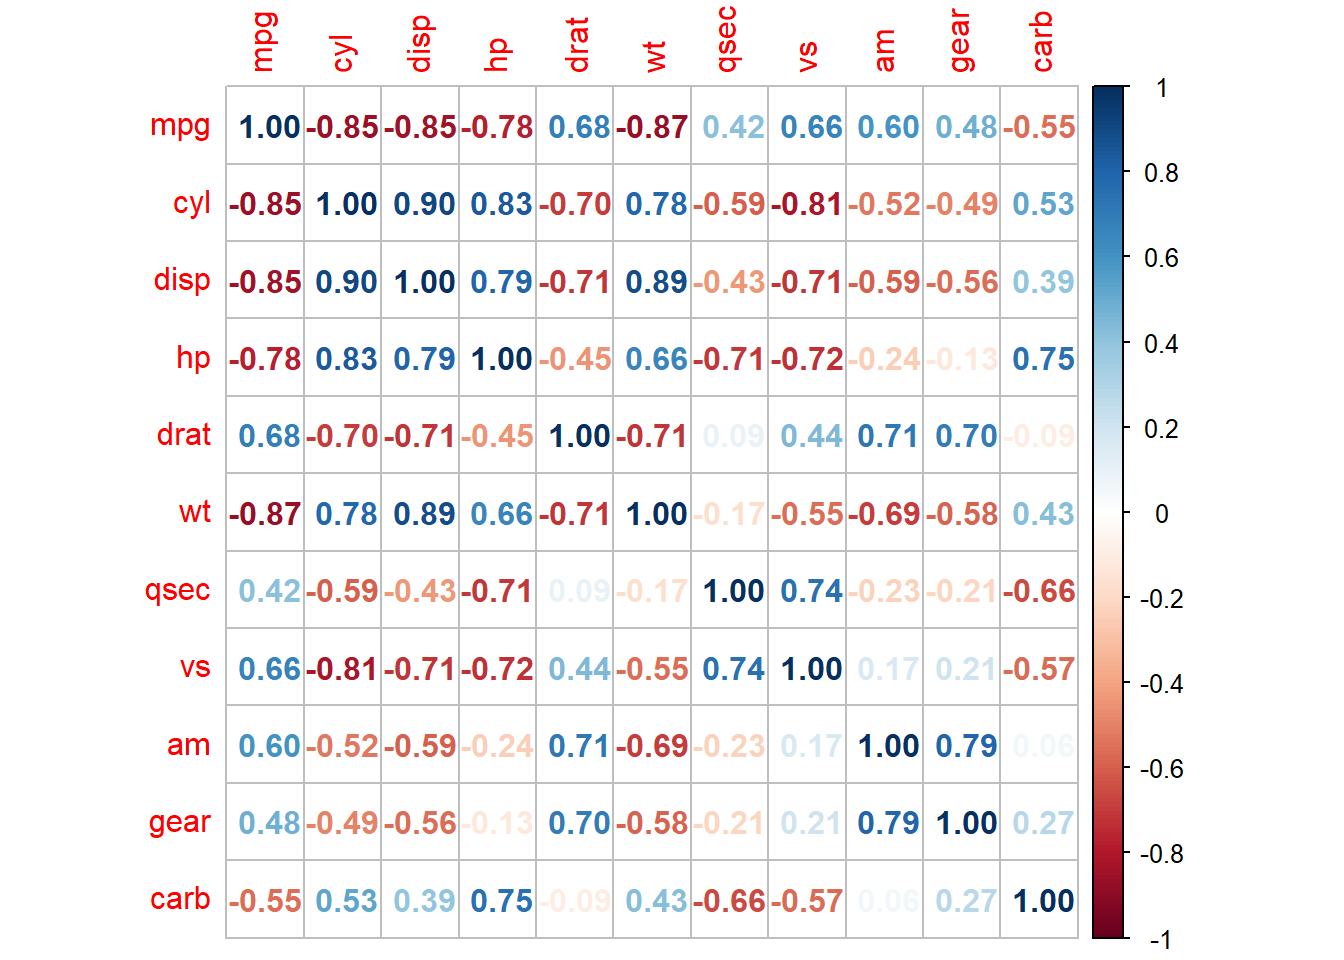
mpg 1.00 -0.85 -0.85 -0.78 0.68 -0.87 0.42 0.66 0.60 0.48 -0.55
cyl -0.85 1.00 0.90 0.83 -0.70 0.78 -0.59 -0.81 -0.52 -0.49 0.53
disp -0.85 0.90 1.00 0.79 -0.71 0.89 -0.43 -0.71 -0.59 -0.56 0.39
hp -0.78 0.83 0.79 1.00 -0.45 0.66 -0.71 -0.72 -0.24 -0.13 0.75
drat 0.68 -0.70 -0.71 -0.45 1.00 -0.71 0.09 0.44 0.71 0.70 -0.09
wt -0.87 0.78 0.89 0.66 -0.71 1.00 -0.17 -0.55 -0.69 -0.58 0.43