Section 52 Poisson Distribution: Example
52.1 Example 1
If at a certain time of the day the number of cars queuing at a specific set of traffic lights is well described by a Poisson distribution with mean 3.1, then we write: \(X \sim Po(\lambda=3.1)\)
The probability that the queue has 9 or fewer cars will be : ppois(q=9, lambda=3.1)
Therefore the probability the queue has more than 9 cars is 1 - 0.9986 or 0.0014.
To find all the Poisson probabilities and the shape of the probability function is dpois
    pois_prob = dpois(0:20,lambda=3.1)
    plot(x=0:20, pois_prob, type="h",
         main="Po(3.1)",
         xlab="r", ylab="Prob(r)")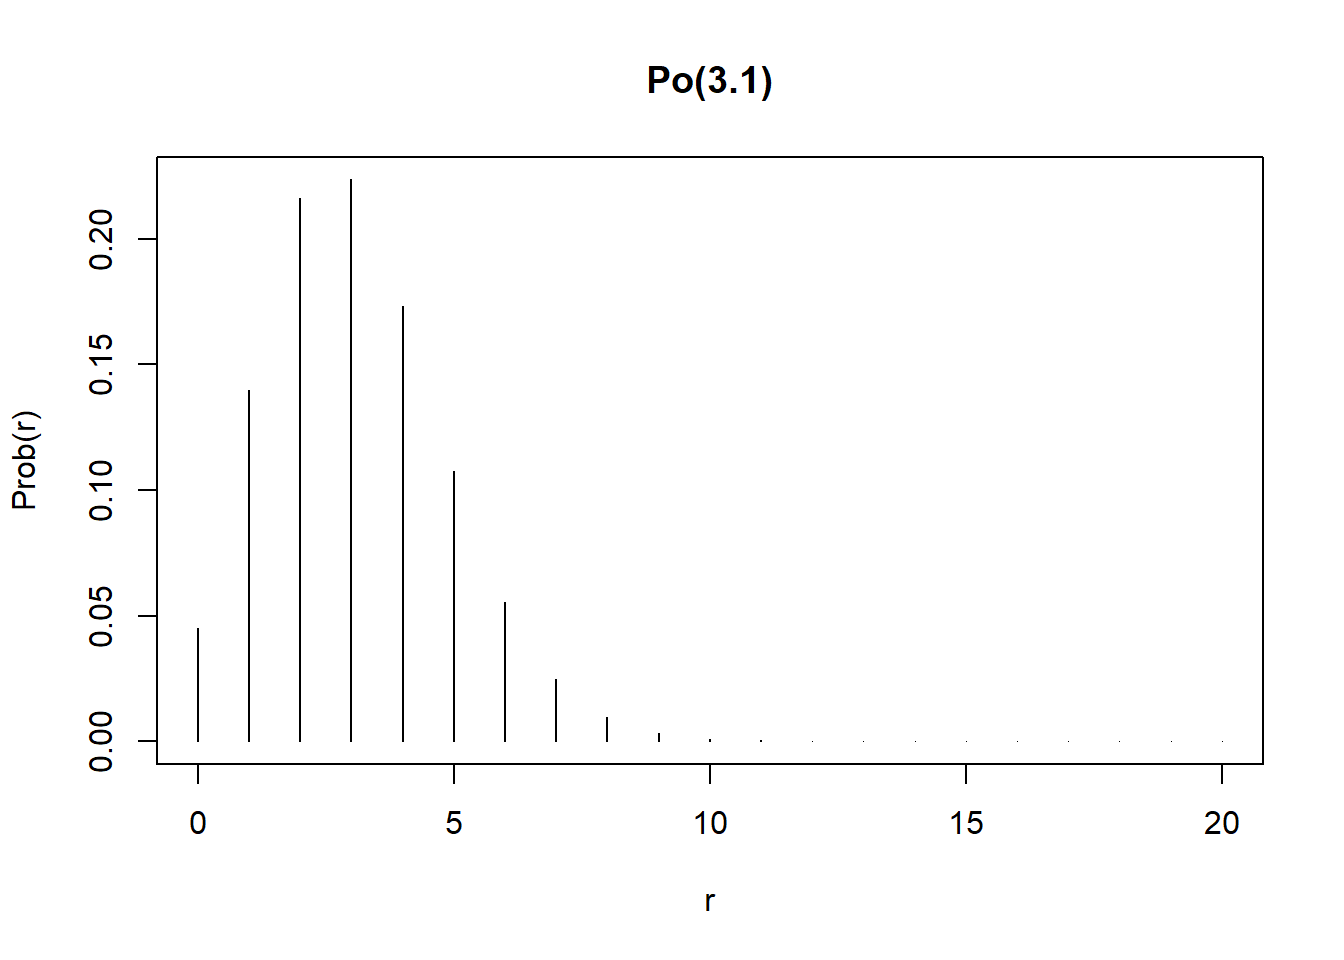
52.2 Example 2
Generate 50 values from a Poisson distribution with mean=4.0, plot them and describe the shape of their distribution.
Is it symmetric?
What are the sample mean and standard deviation? What should they be?
An interesting and important feature of the Poisson distribution is that its variance is the same as its mean.
52.3 Example 3
Assume that the number of beetles found on a plant follows a Poisson distribution with mean 5.
Derive a sample of 100 observations from such plants and plot the data.
What are the mean, variance and sd of these counts?
How many plants would you expect to have more than 5 beetles?
How many would you expect not to have any beetles?